WOI Guides
Candlesticks for Structure — Reading Acceptance and Rejection
How traders use candlesticks to read acceptance, rejection and structural context instead of memorizing endless pattern names.
In this guide
Candles as market information · Why location matters more than pattern names · Acceptance and rejection · What the close reveals · Follow-through matters more than one candle · Candles inside trends and ranges · What matters more than pattern names · Common mistakes · How WOI Scanner uses candle context · Checklist
Candles as market information
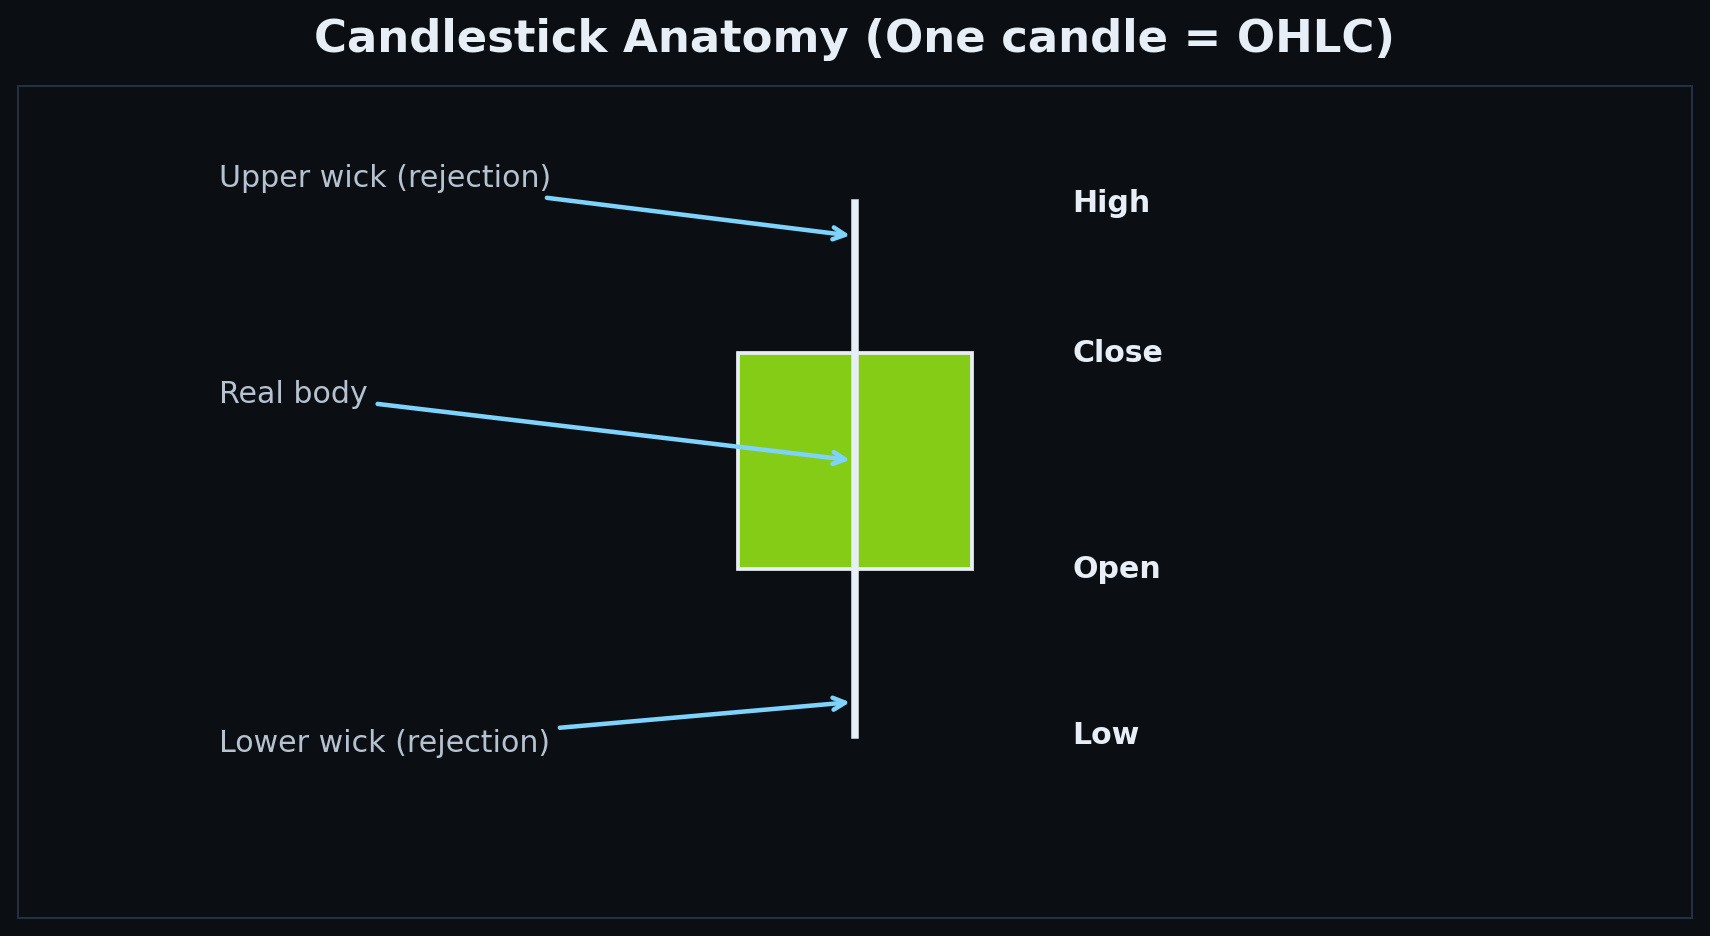
Candlesticks are best understood as compressed market information. Each candle shows what happened during a specific period: where price opened, where it closed, how far it moved, and how much disagreement occurred within that range. A candle is not just a shape. It is evidence of how buyers and sellers behaved during that period. This is why candles become most useful at meaningful levels. A candle forming in the middle of nowhere usually matters far less than a candle forming directly at support, resistance or a breakout level.
- Candles summarize market behavior within a time window.
- They show open, close, range and intraperiod rejection.
- A candle is information, not decoration.
- Location often matters more than the candle shape itself.
- Candles become more useful at important technical levels.
Why location matters more than pattern names
Many beginners memorize dozens of candlestick names and expect those names to produce reliable signals. In practice, the market does not care what a candle is called. What matters is where it appears and what it says about structure. A rejection candle near major resistance can matter. The same candle in the middle of a messy range may mean almost nothing. This is why experienced traders usually care more about location, reaction and follow-through than about pattern labels.
- Pattern names are less important than structural context.
- The same candle can matter greatly in one place and very little in another.
- Location near support or resistance increases relevance.
- A candle should be judged inside the broader chart story.
- Context usually separates useful candles from random noise.
Acceptance and rejection
One of the most useful ways to read candles is through the idea of acceptance and rejection. A strong close through resistance can suggest acceptance at higher prices. A candle that pushes above a level but closes back beneath it can suggest rejection. Long upper wicks near resistance often show that sellers pushed back against higher prices. Long lower wicks near support can show that buyers responded after lower prices were tested. Candles become much more meaningful once traders stop asking what the pattern is called and start asking who accepted or rejected the level.
- Strong closes beyond a level can suggest acceptance.
- Failed pushes beyond a level can suggest rejection.
- Upper wicks often matter near resistance.
- Lower wicks often matter near support.
- Acceptance and rejection help explain candle behavior more clearly than memorized names.
What the close reveals
The close of a candle often tells more than the wick alone. A candle that closes near the top of its range can show control by buyers during that period. A candle that closes near the bottom can show control by sellers. A candle with a large range but a weak close can suggest that the move did not hold as well as it first appeared. This is why traders often pay close attention to how the candle finishes relative to its own range and to nearby levels on the chart.
- The close can reveal which side held control by the end of the period.
- Strong closes often matter more than dramatic wicks alone.
- Weak closes can reduce the importance of a large move.
- Close location inside the candle range matters.
- Closes near key levels often shape the next decision.
Follow-through matters more than one candle
A single candle almost never tells the whole story. Even a strong-looking rejection or breakout candle still needs follow-through. If the next candles confirm the message, the original signal becomes more credible. If the next candles immediately fail, the first candle may have been less meaningful than it looked. This is one of the most important ideas in candle reading: a candle is evidence, not proof. What happens next often determines whether the market actually accepted that message.
- One candle rarely creates a full trade thesis by itself.
- Follow-through often validates the candle’s message.
- Immediate failure can weaken a seemingly strong candle.
- The next candles help confirm or deny the first signal.
- Candles are best read as part of a sequence.
Candles inside trends and ranges
Candles behave differently in trends and in ranges. In strong trends, continuation candles and controlled pullback candles may matter more than dramatic reversal-looking candles. In ranges, rejection candles near the boundaries can become more relevant because price is repeatedly testing balance edges. This is another reason why candles should not be interpreted in isolation. Market regime changes what a candle is likely to mean and how much weight it deserves.
- Trend context changes the meaning of candles.
- Continuation candles may matter more in strong trends.
- Rejection candles may matter more near range boundaries.
- The same candle can behave differently in trend and range regimes.
- Market regime should always be part of candle analysis.
What matters more than pattern names
When traders use candles effectively, they usually focus on a small set of practical questions. Did the candle appear at a meaningful level? Was the close strong or weak? Did the wick show real rejection? Did the next candles confirm the signal? These questions are often far more useful than memorizing large lists of named formations. The goal is not to become a candle collector. The goal is to understand what the market is communicating at important moments.
- Location matters more than the pattern label.
- Close strength matters more than memorized names.
- Wicks should be interpreted relative to levels.
- Confirmation often matters more than recognition.
- Practical questions beat pattern memorization.
Common mistakes
Most candlestick mistakes come from forcing meaning onto every bar. Traders often overreact to one candle, ignore the larger structure, or treat a rejection wick as a guaranteed reversal. Others memorize endless candle names but never ask whether the candle appeared at a meaningful level. Candles become much more useful once traders stop looking for magic signals and start reading them as evidence inside the broader technical story.
- Forcing named patterns onto random candles.
- Ignoring structure and focusing on one bar only.
- Assuming a single rejection candle guarantees reversal.
- Overvaluing candle names and undervaluing location.
- Reading candles without asking for confirmation.
How WOI Scanner uses candle context
The WOI Scanner does not rely on candlestick names as stand-alone triggers. Instead, candle behavior can enrich the broader narrative by showing whether price accepted a breakout, rejected a level, or failed to hold a move. This helps make the analysis more grounded. The candle is not the whole signal. It is one layer of evidence that becomes useful when combined with structure, levels and follow-through.
- Candles help enrich narrative context in the scanner.
- Acceptance and rejection behavior matter more than labels.
- Candle context can support breakouts and failed breaks.
- The scanner uses candles as supporting evidence, not as a system by themselves.
- Structure remains the primary framework.
Checklist
Before acting on a candle, it helps to pause and ask whether the bar actually appeared in a place where it matters and whether the market confirmed its message. That small pause often prevents traders from overreacting to ordinary noise.
- Did the candle form at a meaningful level?
- Was the close strong or weak relative to the range?
- Did the wick show real acceptance or rejection?
- Did the next candles confirm the message?
- Does the candle fit the broader structure and regime?
- Would the idea still make sense without forcing the pattern name?
Apply this in WOI
Open the scanner, pick one symbol, and practice:
mark zones, decide trend regime, and write one invalidation level.
The goal is a repeatable process, not perfect predictions.
Disclaimer: Educational content only. Not financial advice.