WOI Guides
Technical Analysis Basics — A Practical Framework
A trader-grade framework for reading charts through structure, levels, confirmation and risk management.
In this guide
Why technical analysis exists · What technical analysis really is · Price is behavior, not just numbers · The 4-step workflow · Trend, structure and momentum · How traders read a chart in practice · Why process matters more than prediction · When not to trade · Common beginner traps · How this connects to the WOI Scanner · Checklist before opening a trade
Why technical analysis exists
Technical analysis exists because markets are driven by human behavior, positioning, fear, and greed. Price charts are not random lines; they are the visual representation of decisions made by thousands of market participants. Traders use technical analysis not to predict the future perfectly, but to build structured trade ideas with defined risk and logical entry points. The main goal is not prediction, but decision quality and risk control.
- Markets move because participants buy and sell for different reasons.
- Charts show where buyers and sellers agreed and where they disagreed.
- Technical analysis helps traders build structured trade ideas.
- The goal is not prediction, but risk management and decision quality.
- Good technical analysis focuses on structure, levels and behavior.
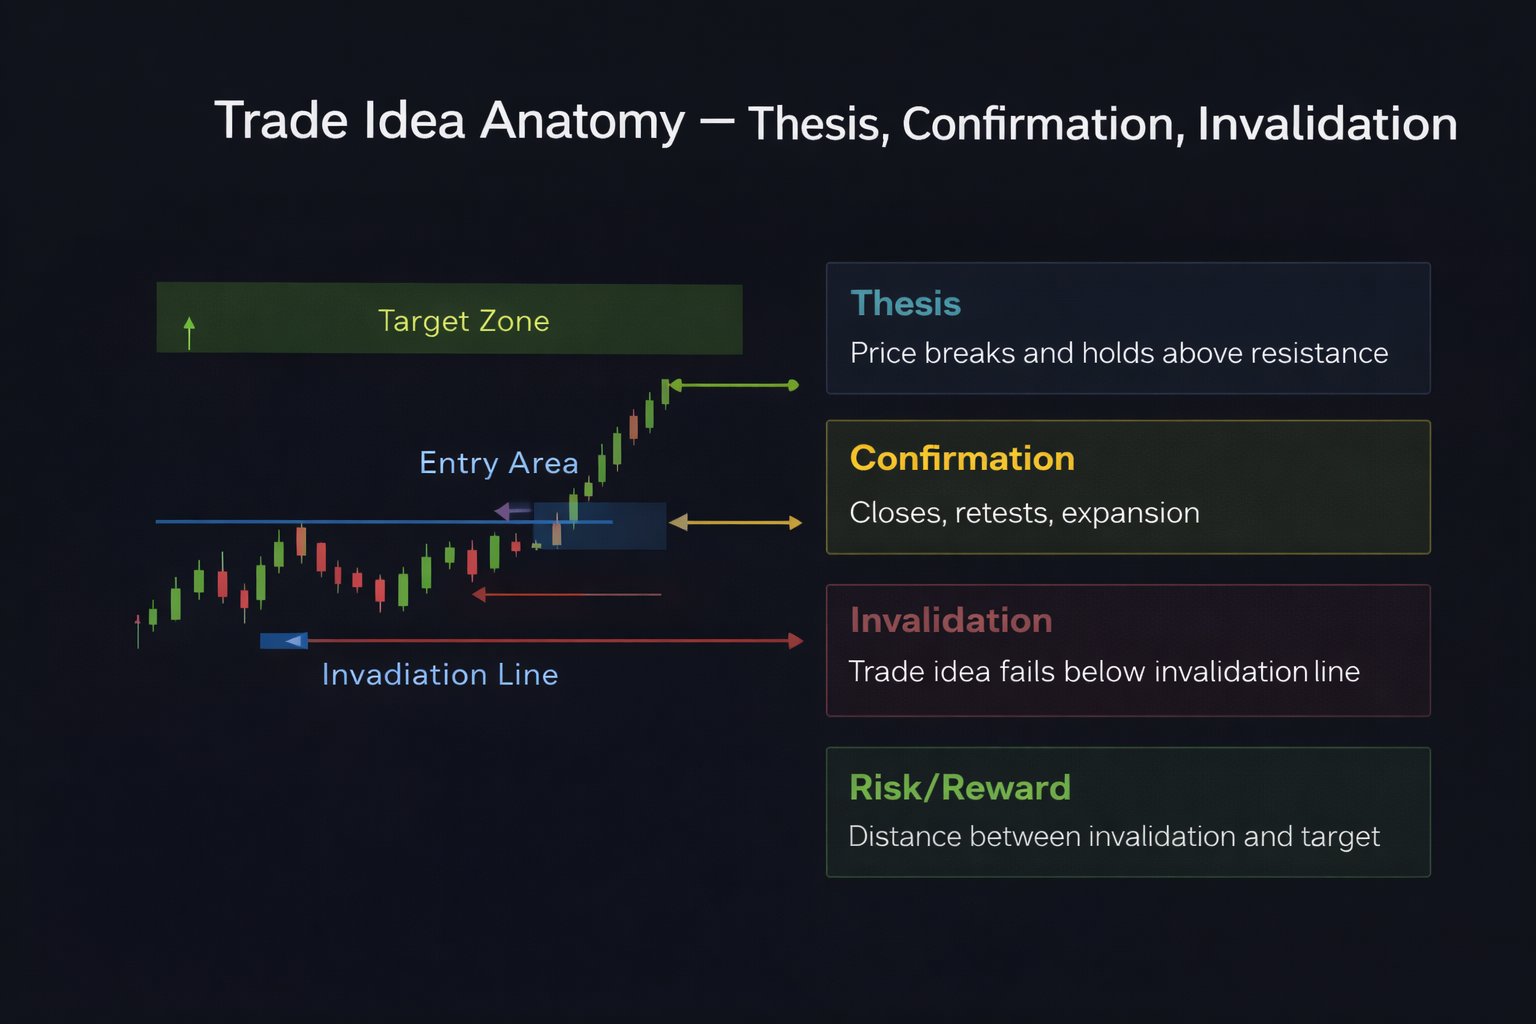
What technical analysis really is
Technical analysis is the study of price behavior, trend structure and market reactions in order to build a repeatable trading process. It is not a prediction machine. Its real value is helping traders define a thesis, identify invalidation, and manage risk before the trade is placed. The best use of technical analysis is practical decision-making: what is happening now, what confirms the idea, and what proves the idea wrong.
- Technical analysis focuses on price, structure and behavior.
- It helps traders define thesis, confirmation and invalidation.
- Charts help traders understand what is happening now.
- The goal is not to be right all the time, but to manage risk.
- Technical analysis is a decision framework, not a signal generator.
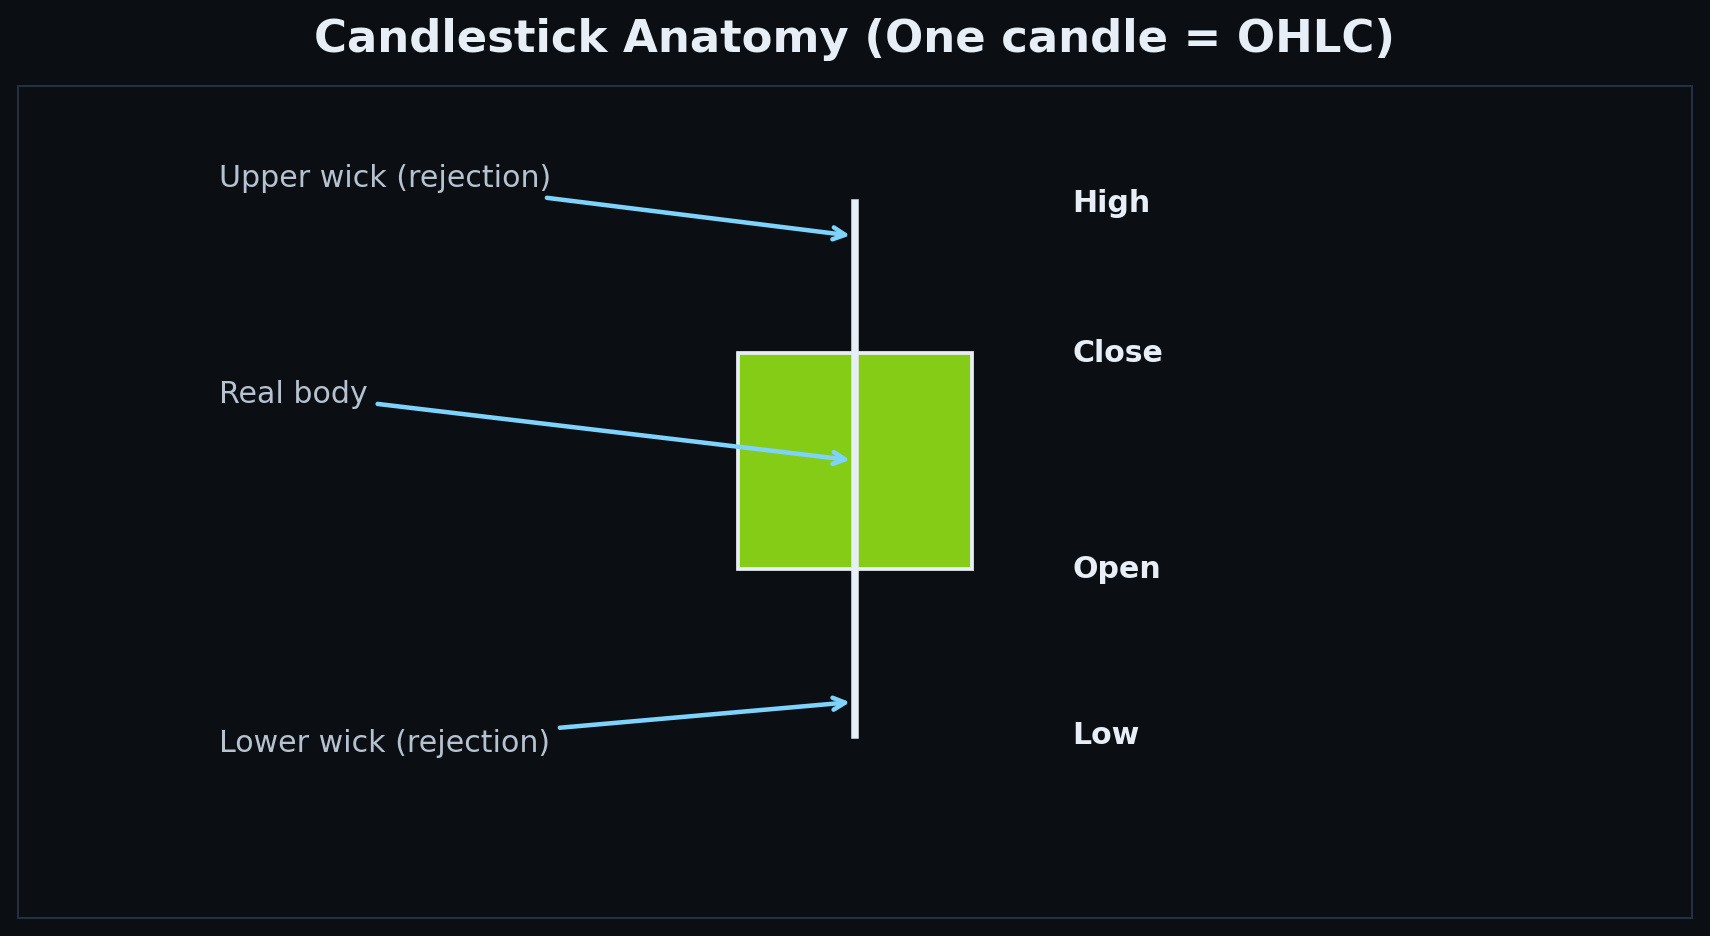
Price is behavior, not just numbers
Many beginners see charts as random lines moving up and down, but experienced traders see behavior. Every candle represents decisions made by buyers and sellers. Strong moves usually happen when one side of the market is trapped and forced to exit. Markets often move between balance and imbalance: consolidation means agreement, expansion means disagreement.
- Price charts represent decisions made by market participants.
- Strong moves often happen when traders are trapped.
- Markets move between balance and imbalance.
- Breakouts often start when price leaves consolidation.
- Understanding behavior is more important than memorizing indicators.
The 4-step workflow
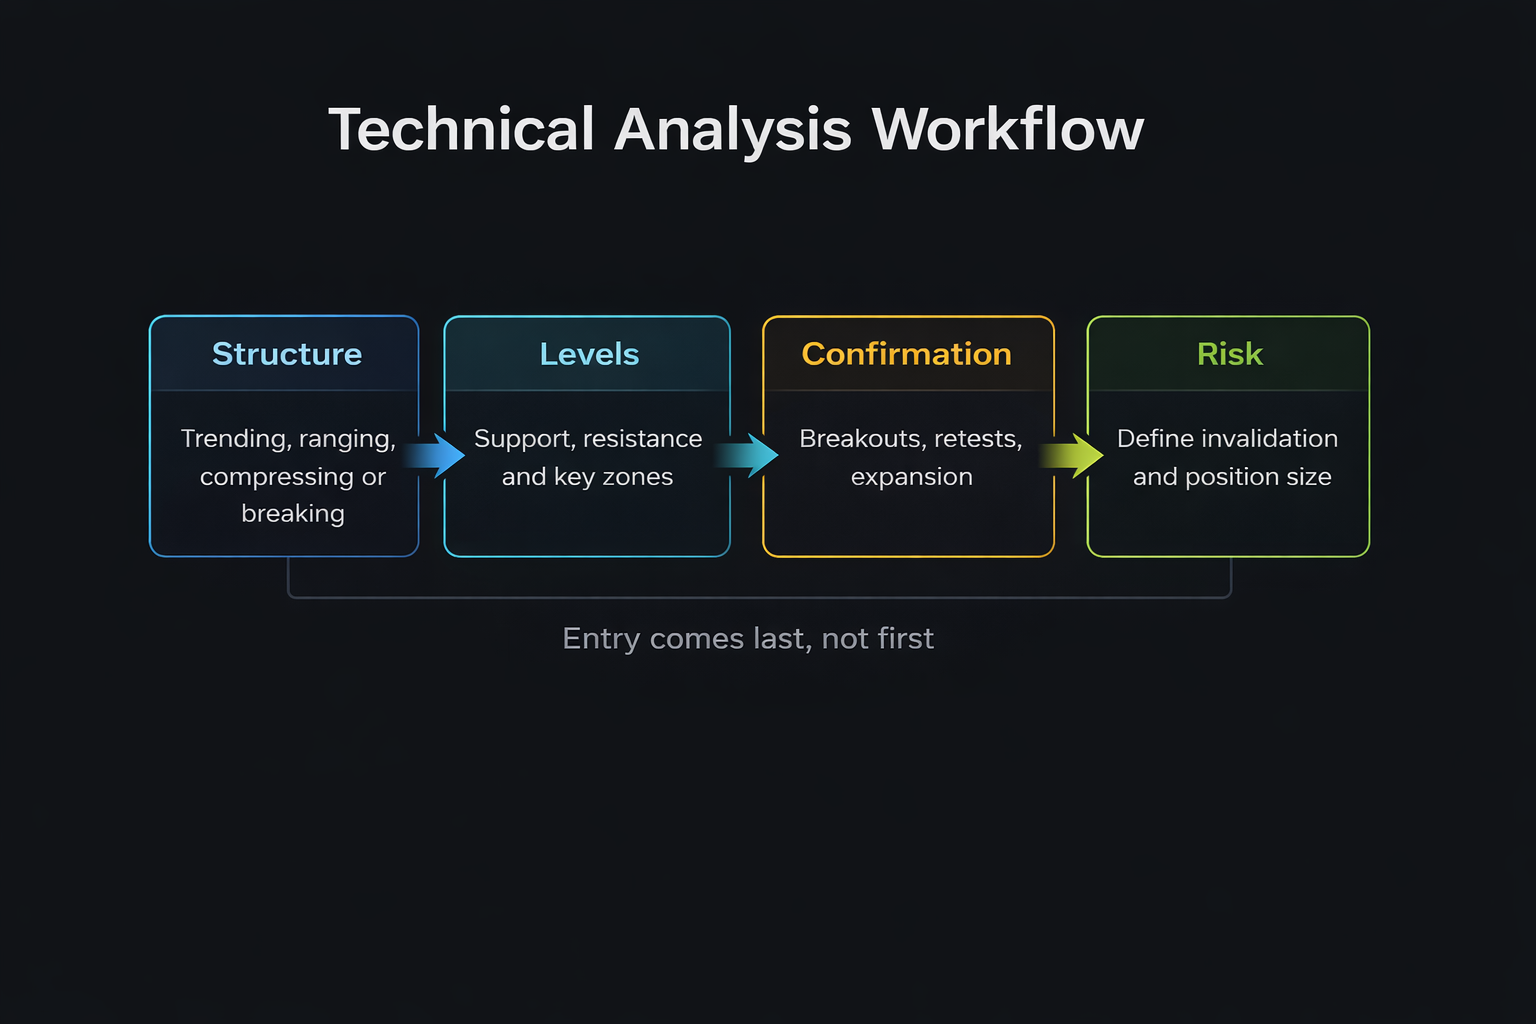
A practical way to use technical analysis is to follow a simple workflow. Instead of jumping directly into indicators or entries, traders first understand structure, then levels, then confirmation, and finally risk. This order is important because entries should come last, not first.
- Step 1 — Structure: trending, ranging, compressing or breaking.
- Step 2 — Levels: support and resistance zones.
- Step 3 — Confirmation: breakouts, retests, momentum.
- Step 4 — Risk: define invalidation and position size.
- Always think in scenarios: confirmation vs invalidation.
Trend, structure and momentum
Most technical analysis can be simplified into three ideas: trend, structure, and momentum. Trend tells the direction, structure tells where price is inside that trend, and momentum tells the strength of the move. The best trading opportunities usually happen when all three align.
- Trend shows direction.
- Structure shows where price is inside the trend.
- Momentum shows the strength of the move.
- Best setups happen when trend, structure and momentum align.
- If structure breaks, the trend may be changing.
How traders read a chart in practice
When experienced traders open a chart, they do not immediately look for indicators. They first try to understand the story of the chart. They look at where the trend started, where pullbacks happened, where breakouts failed, and where traders might be trapped. Technical analysis is often about understanding positioning and behavior rather than drawing perfect lines.
- Where did the trend start?
- Where did pullbacks hold?
- Where did breakouts fail?
- Where might traders be trapped?
- Where would breakout traders enter?
- Where would the trade idea be invalidated?
Why process matters more than prediction
Markets are probabilistic, not certain. Even the best setups fail sometimes. Professional traders focus on process and risk management rather than trying to predict every move. A trader with a strong process can survive being wrong many times because losses are small and controlled.
- Markets are probabilistic, not certain.
- Risk must be defined before entering a trade.
- Consistency comes from process, not predictions.
- Professional trading is risk management first.
- Good trades come from good risk control.
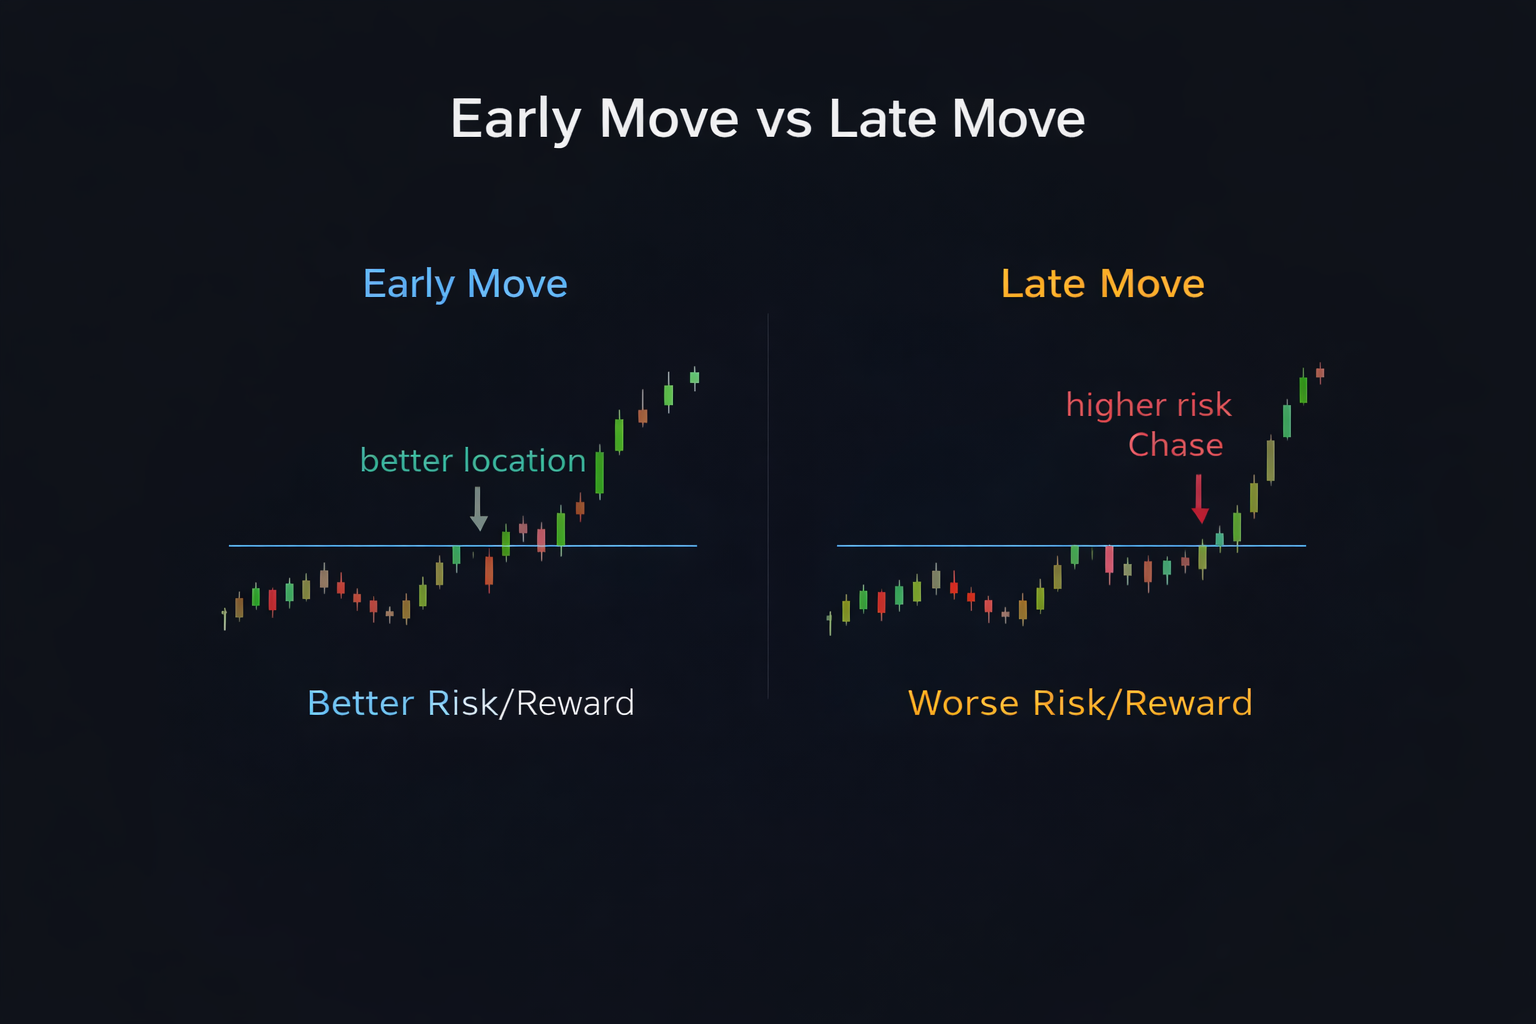
When not to trade
One of the most important skills in trading is knowing when not to trade. Many losses happen not because the idea was wrong, but because the trade was taken in a bad location. Technical analysis is not only about finding trades, but also about avoiding low-quality situations.
- Avoid trading in the middle of a range.
- Avoid entering after a very extended move.
- Avoid trades where invalidation is very far.
- Avoid low volatility environments.
- Avoid messy charts with unclear structure.
- Sometimes the best trade is no trade.
Common beginner traps
Many beginners make the same mistakes when they start using technical analysis. They focus too much on indicators, draw too many lines, or enter trades after large moves. Most of these mistakes come from focusing on entries instead of risk and structure.
- Drawing too many lines.
- Using indicators without structure.
- Entering after extended moves.
- Ignoring invalidation levels.
- Risking too much on one trade.
How this connects to the WOI Scanner
The WOI Scanner is built around the same technical analysis principles described in this guide. Instead of manually scanning hundreds of charts, the scanner ranks stocks based on trend structure, momentum, breakouts, triangle compression and technical quality. The goal is not to generate buy or sell signals, but to help traders find charts worth analyzing.
- Top Picks show strong overall technical structure.
- Momentum screener shows trend leaders.
- Downtrend Break screener finds breakout structures.
- Triangle screener finds compression patterns.
- Each stock page shows support, resistance and technical narrative.
Checklist before opening a trade
Before entering any trade, it helps to go through a simple checklist. This prevents emotional decisions and forces the trader to think about structure, risk, and reward before entering the trade.
- What is the dominant trend?
- Where are support and resistance zones?
- What confirms the setup?
- Where is invalidation?
- Is risk to reward acceptable?
- Is the move early or extended?
- Does the trade make structural sense?
Apply this in WOI
Open the scanner, pick one symbol, and practice:
mark zones, decide trend regime, and write one invalidation level.
The goal is a repeatable process, not perfect predictions.
Disclaimer: Educational content only. Not financial advice.