WOI Guides
Trendlines and Market Structure
How to read higher highs, higher lows and draw trendlines that reflect real structure.
In this guide
Market structure basics
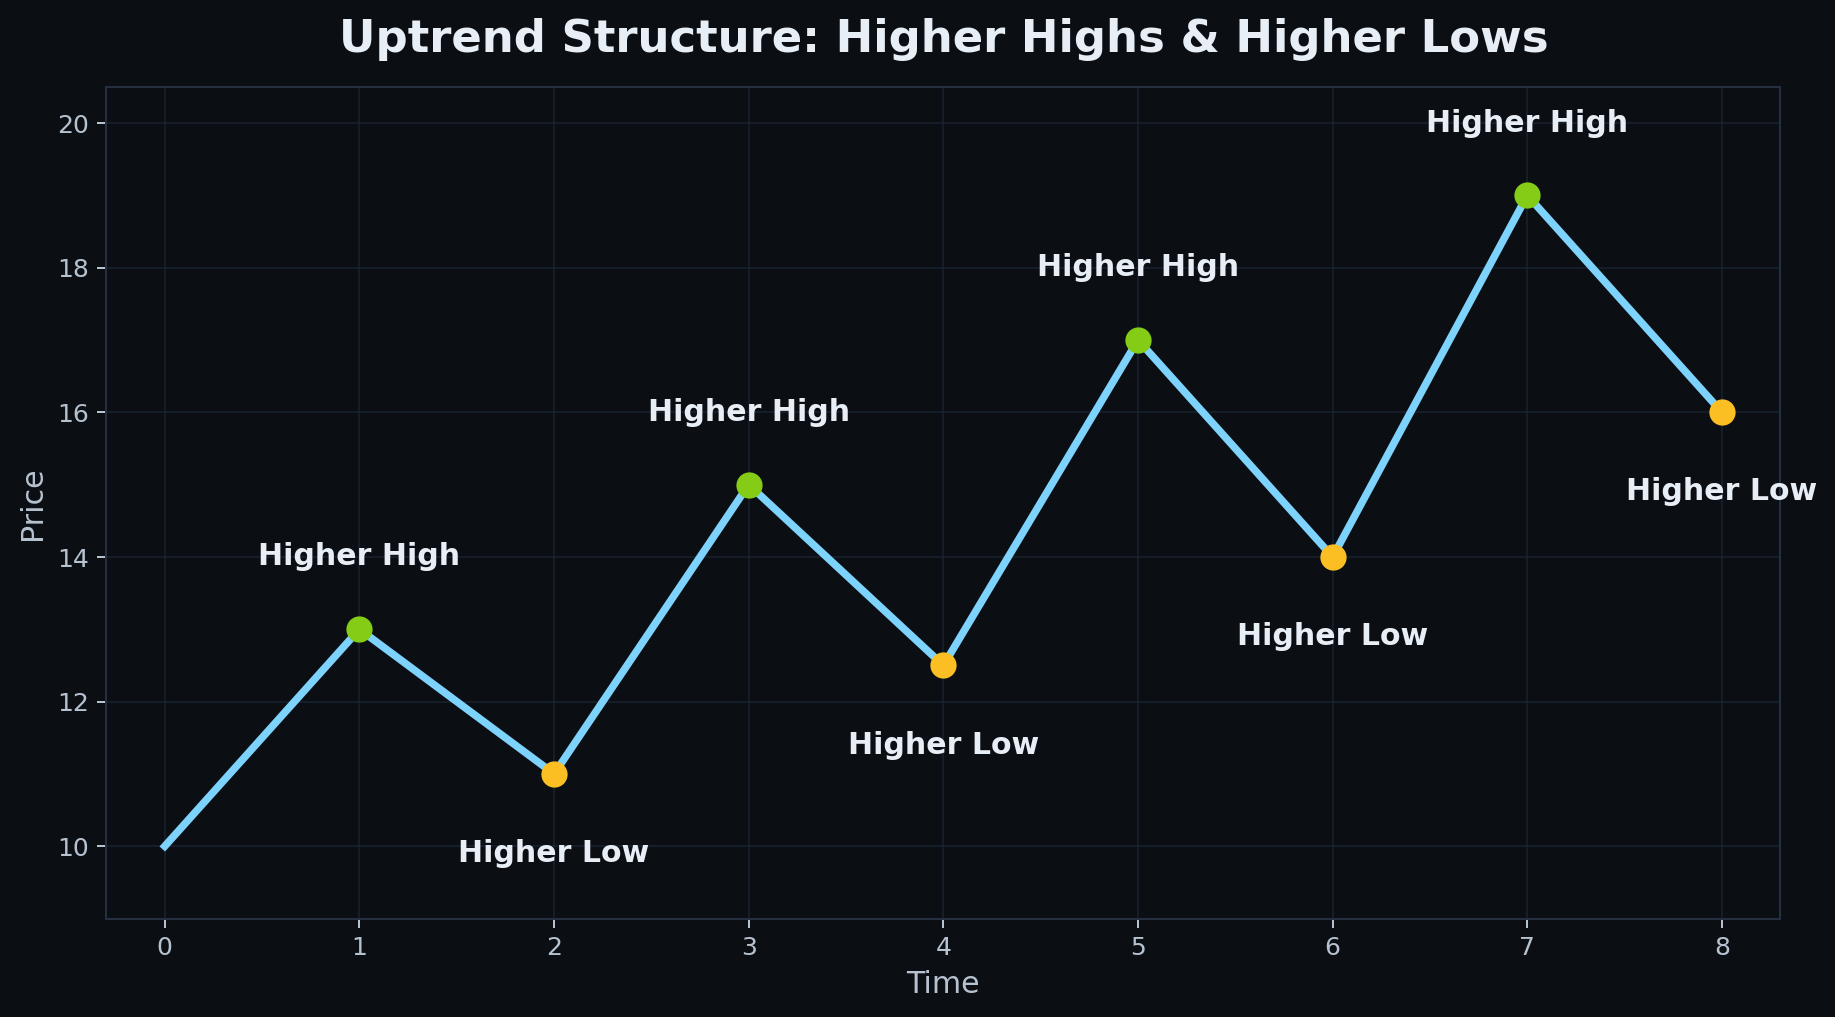
Market structure is the foundation of chart reading. Before drawing any line, a trader should first ask whether price is making higher highs and higher lows, lower highs and lower lows, or neither. This matters because structure tells you whether the market is trending, weakening, or rotating sideways. Trendlines are helpful only when they reflect that underlying structure.
- Uptrends consist of higher highs and higher lows.
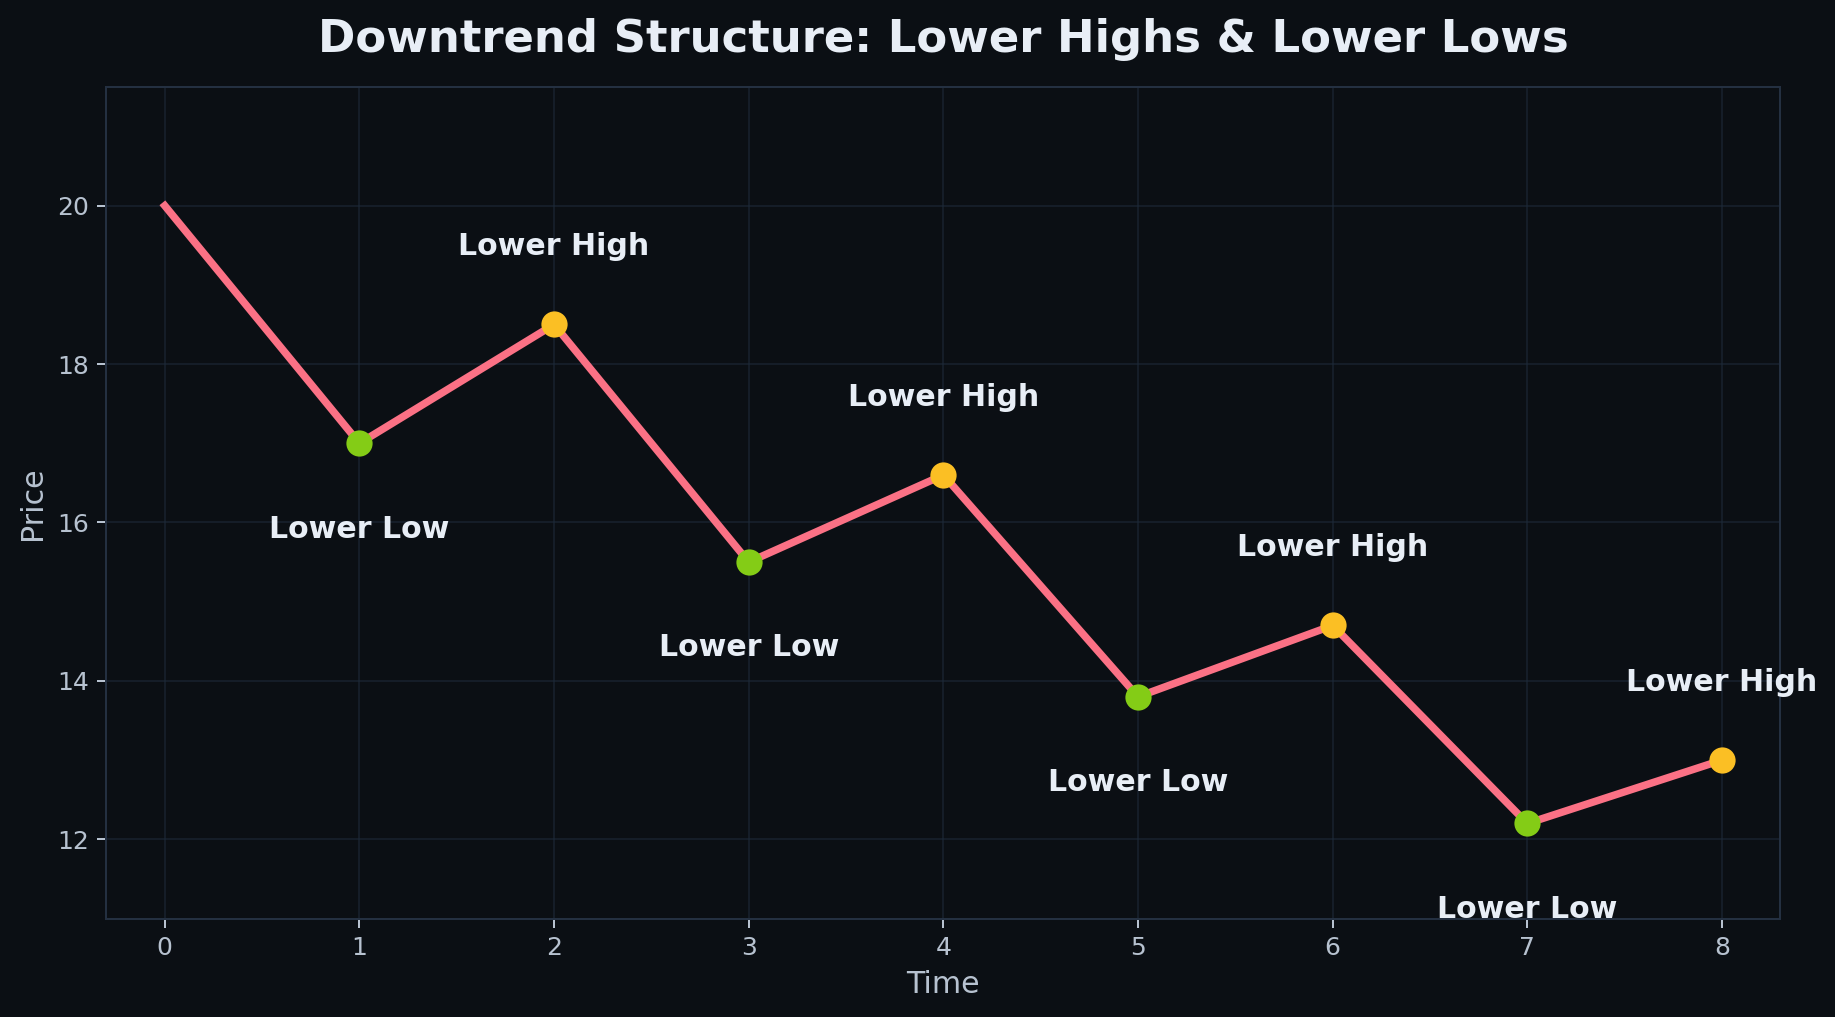
- Downtrends consist of lower highs and lower lows.
- When neither pattern dominates, markets are often ranging.
- Structure helps traders distinguish healthy pullbacks from actual deterioration.
- A clean sequence of swings is usually more important than any individual candle.
Why structure matters more than lines
A common mistake is to treat trendlines as magical barriers. In reality, the line itself is less important than the swing structure behind it. A chart with clear higher lows may still be bullish even if price briefly pierces a line. Likewise, a perfect-looking line means very little if the actual swing sequence is already breaking down.
- Trendlines should reflect swing structure, not replace it.
- Higher highs and higher lows matter more than a perfectly drawn line.
- A brief line break does not always mean the trend is over.
- If the swing structure deteriorates, the trend may be weakening even before a line breaks.
- Good traders read the story of the chart first and the line second.
Drawing useful trendlines
Useful trendlines connect meaningful pivots that clearly stand out on the chart. The goal is not artistic precision but structural clarity. A good trendline helps visualize where the market has been respecting a directional path. It should be easy to explain why the line matters and why traders might react to it.
- Use swing highs and lows that clearly stand out on the chart.
- Two touches define a line, while three touches strengthen it.
- Trendlines are tools to visualize structure rather than precise barriers.
- The cleanest lines usually come from obvious pivots, not crowded noisy candles.
- Higher timeframe trendlines usually carry more weight than very small intraday lines.
What makes a trendline weak or misleading
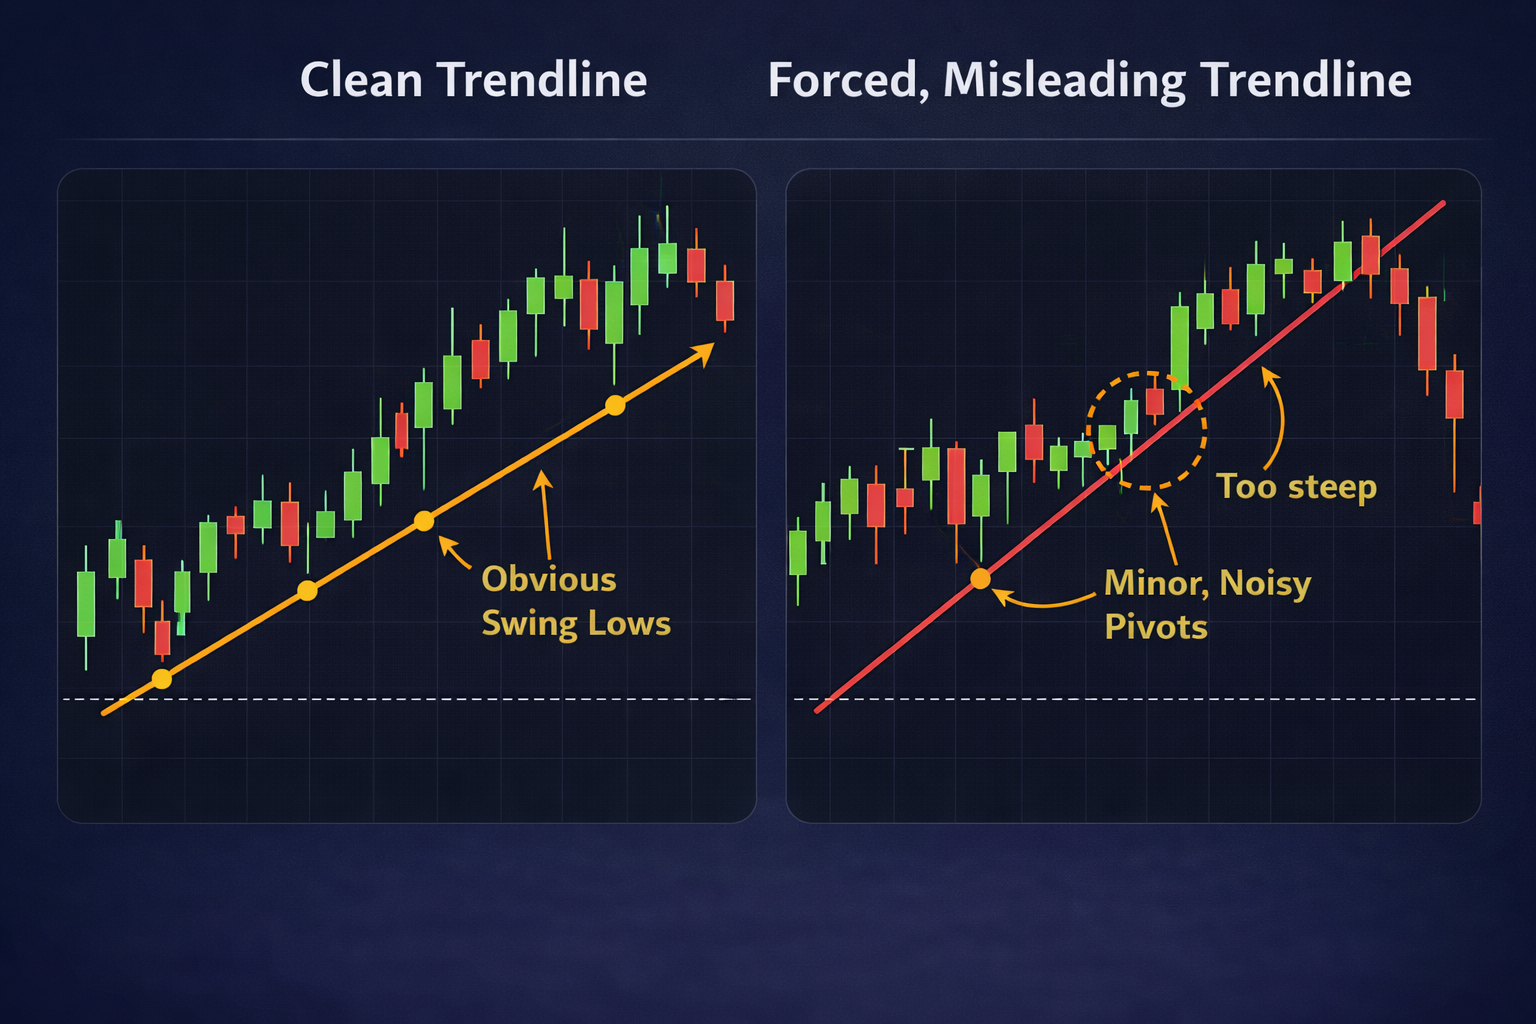
Not every line on a chart is useful. Some lines are forced, overly steep, or built from insignificant pivots. These lines may look convincing at first glance but provide little real information. A trader should be suspicious of any line that only works after excessive adjustment or that depends on ignoring the more obvious swing points.
- Trendlines built from minor noisy pivots are often unreliable.
- Very steep lines often break quickly and may reflect acceleration rather than sustainable trend.
- A line that needs constant redrawing may not represent stable structure.
- If the line conflicts with obvious market structure, structure usually matters more.
- Cleaner and simpler trendlines are usually more useful than complicated ones.
Break and retest
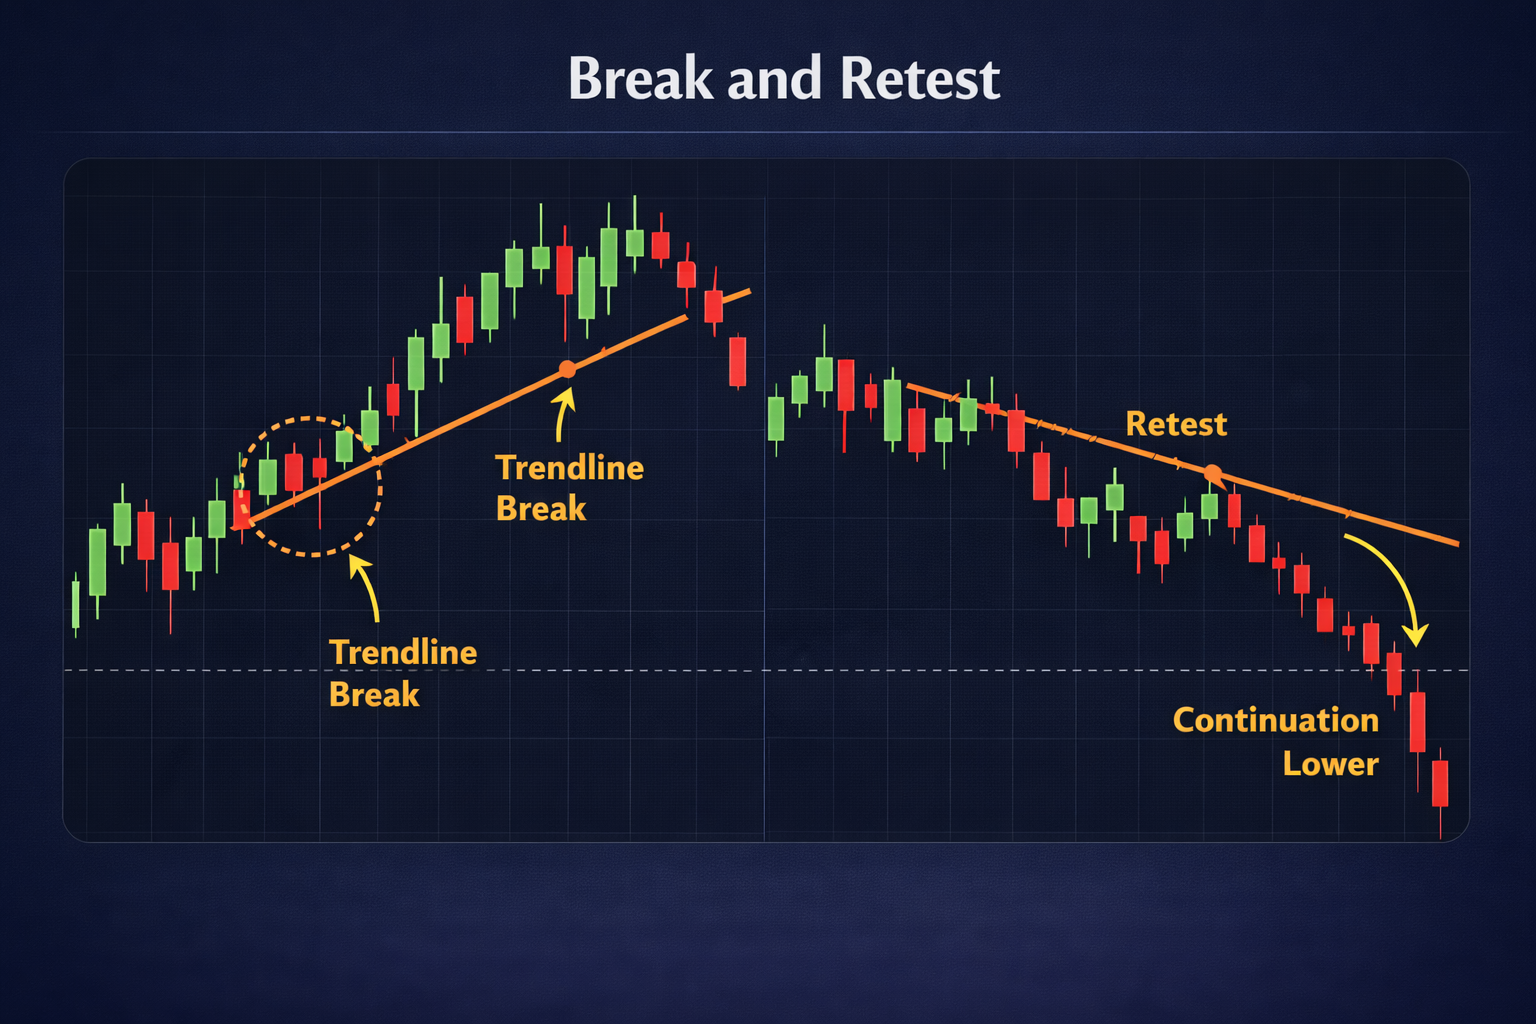
A trendline break can be meaningful, but the best information usually comes after the break. A retest helps show whether the old trend path has truly failed or whether the move was just temporary noise. Traders often wait for price to retest the broken line and react before making a stronger conclusion.
- A break of a trendline can signal that the previous trend may be weakening.
- Confirmation often occurs when price retests the line and reacts.
- False breaks happen when price quickly returns inside the prior structure.
- Retests often provide cleaner entries than reacting to the first break itself.
- The reaction after the break matters more than the first touch beyond the line.
Trendline break vs structure break
A trendline break and a structure break are not always the same thing. Price may pierce a line while still maintaining higher lows, or it may preserve the line visually while already failing structurally. Traders should separate line-based signals from structure-based signals. A true structural break usually carries more meaning than a cosmetic line break.
- A line break without structural damage may only be temporary noise.
- A lower low in an uptrend often matters more than a small line violation.
- A structure break suggests the trend may be changing in a deeper way.
- Trendline breaks become more important when combined with loss of momentum or failed retests.
- The strongest warning signs happen when line, structure and momentum all weaken together.
How traders use trendlines in real trade planning
Professional traders use trendlines to improve context, not to replace a trade plan. A trendline can help define where a pullback is still healthy, where a break may need confirmation, and where invalidation becomes clearer. This is especially useful when trendlines align with horizontal levels, prior pivots, or moving averages.
- A trader may use a rising trendline to judge whether a pullback is still constructive.
- A break and failed retest can help frame a short thesis in a weakening market.
- Trendlines are most useful when combined with support and resistance zones.
- The line can help define where a trade idea no longer makes sense.
- Context, structure and risk matter more than touching the line itself.
Common mistakes
Trendlines are easy to draw badly. Most mistakes come from trying to force certainty out of a chart instead of reading the most obvious structure. A clean chart with one useful line is often better than a chart full of lines that say nothing.
- Forcing lines through pivots that do not really matter.
- Treating every line break as a trend reversal.
- Ignoring the actual swing structure while focusing only on the line.
- Using too many trendlines on one chart.
- Drawing steep acceleration lines and expecting them to hold for long.
Checklist
Before using a trendline as part of a trade idea, it helps to confirm that the broader structure actually supports the interpretation.
- Does the chart show a clear sequence of highs and lows?
- Is the trendline aligned with meaningful pivots?
- Did price confirm the break with follow-through or retest behavior?
- Does the line agree with broader structure and momentum?
- Where would the structure be invalidated if the idea fails?
Apply this in WOI
Open the scanner, pick one symbol, and practice:
mark zones, decide trend regime, and write one invalidation level.
The goal is a repeatable process, not perfect predictions.
Disclaimer: Educational content only. Not financial advice.