WOI Guides
WOI Guides — Technical Analysis Education (Evergreen)
Practical, plain-English technical analysis guides designed for evergreen search: structure, levels, breakouts, indicators, and risk management.
Technical Analysis Basics — A Practical Framework
A trader-grade framework for reading charts through structure, levels, confirmation and risk management.
Read ↗
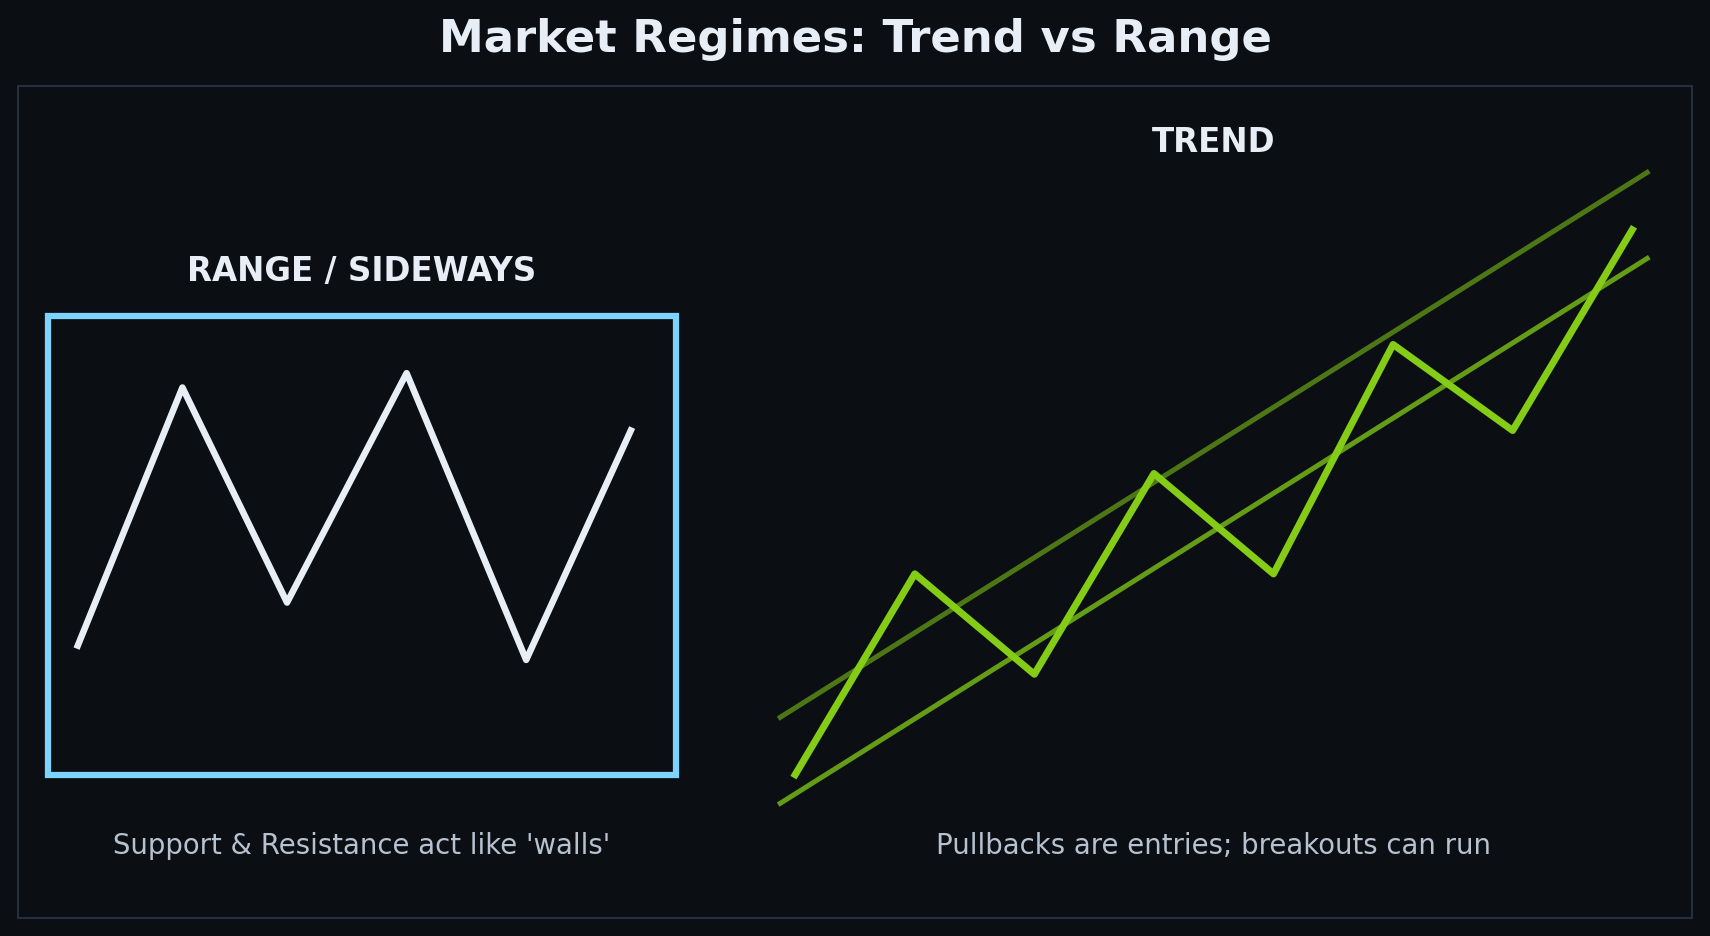
Market Regimes — Trend vs Range
Understanding whether the market is trending or ranging is one of the most important trading skills.
Read ↗
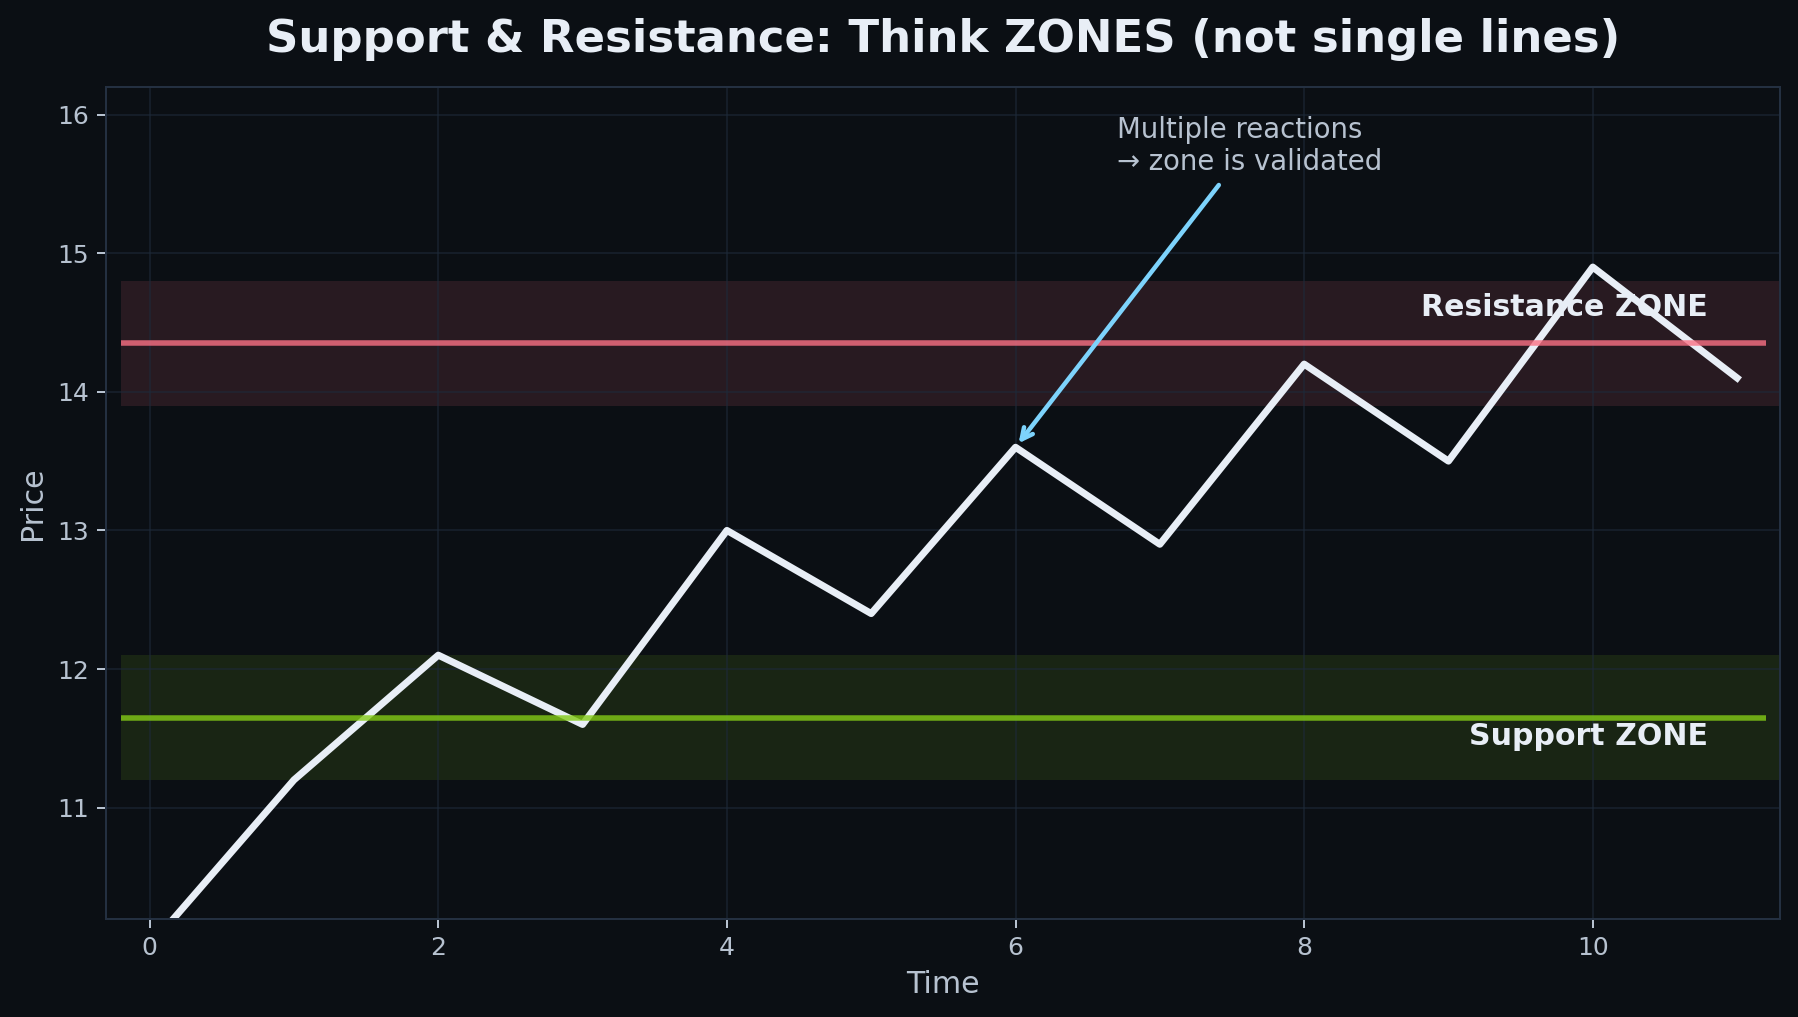
Support and Resistance — Zones, Not Lines
Understanding how price reacts around important levels and why zones are more useful than exact prices.
Read ↗
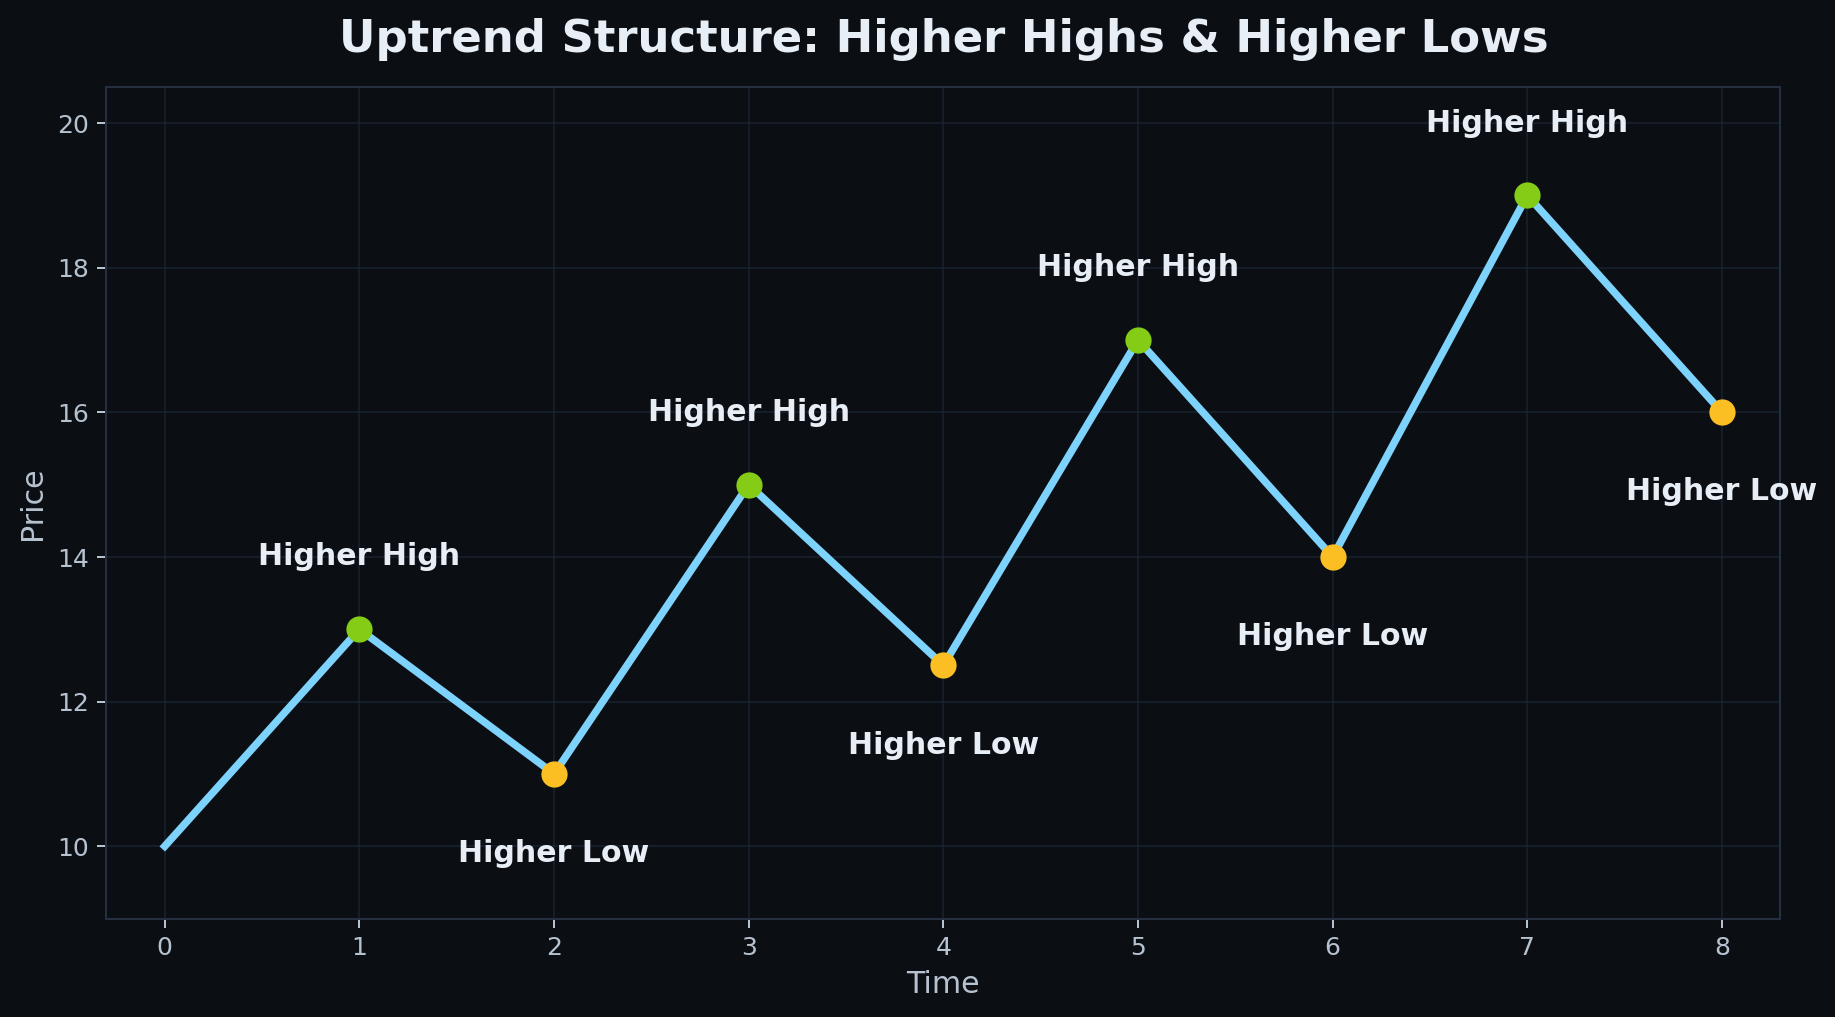
Trendlines and Market Structure
How to read higher highs, higher lows and draw trendlines that reflect real structure.
Read ↗
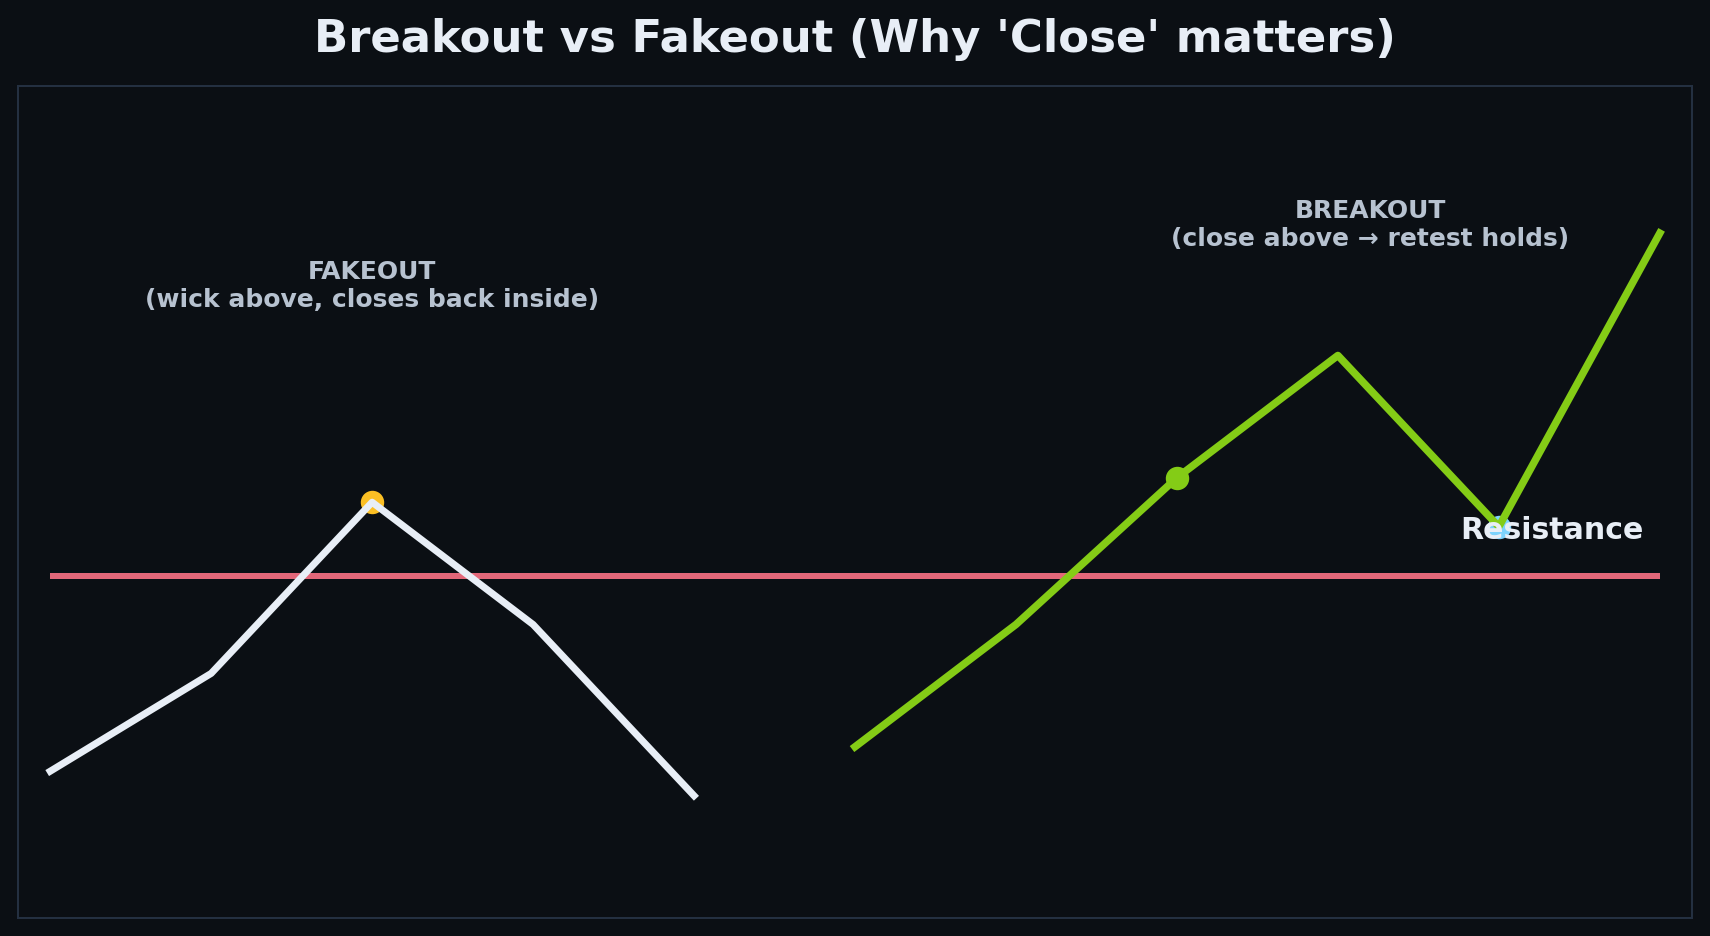
Breakouts & Fakeouts — How to Reduce Traps
A trader-grade breakout checklist: closes, acceptance, retests, and why most breakouts fail near obvious levels.
Read ↗
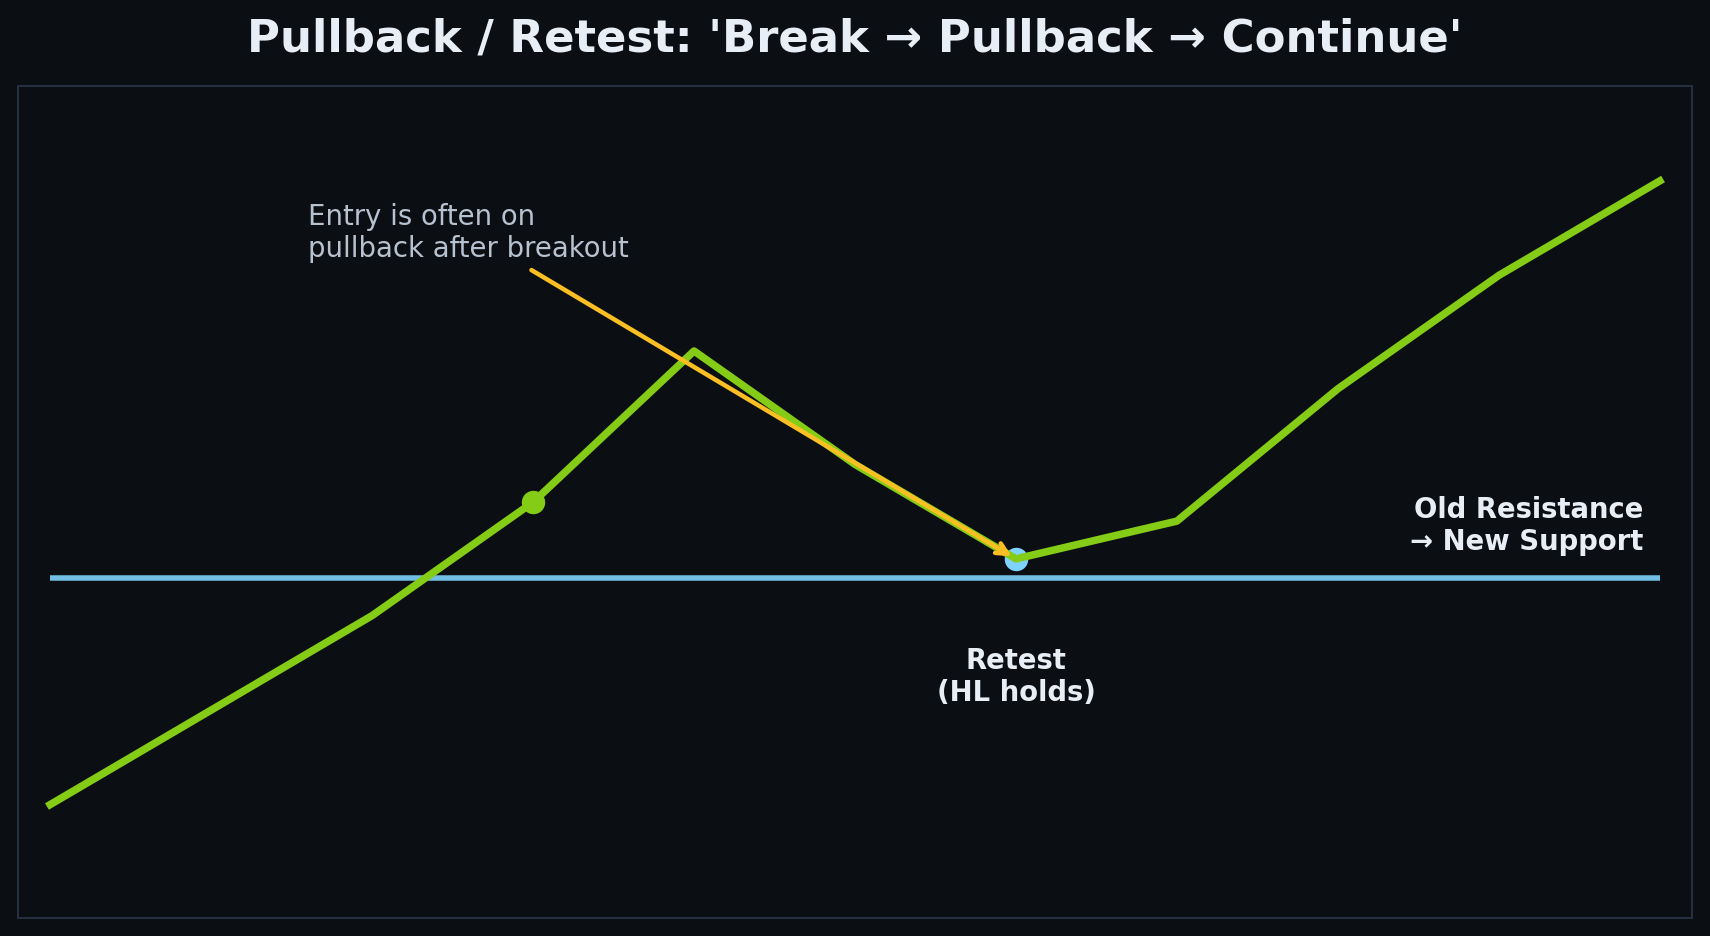
Pullbacks & Retests — Healthy vs Weak
How to interpret pullbacks after a move: higher-low structure, retest quality, and where most traders get chopped.
Read ↗
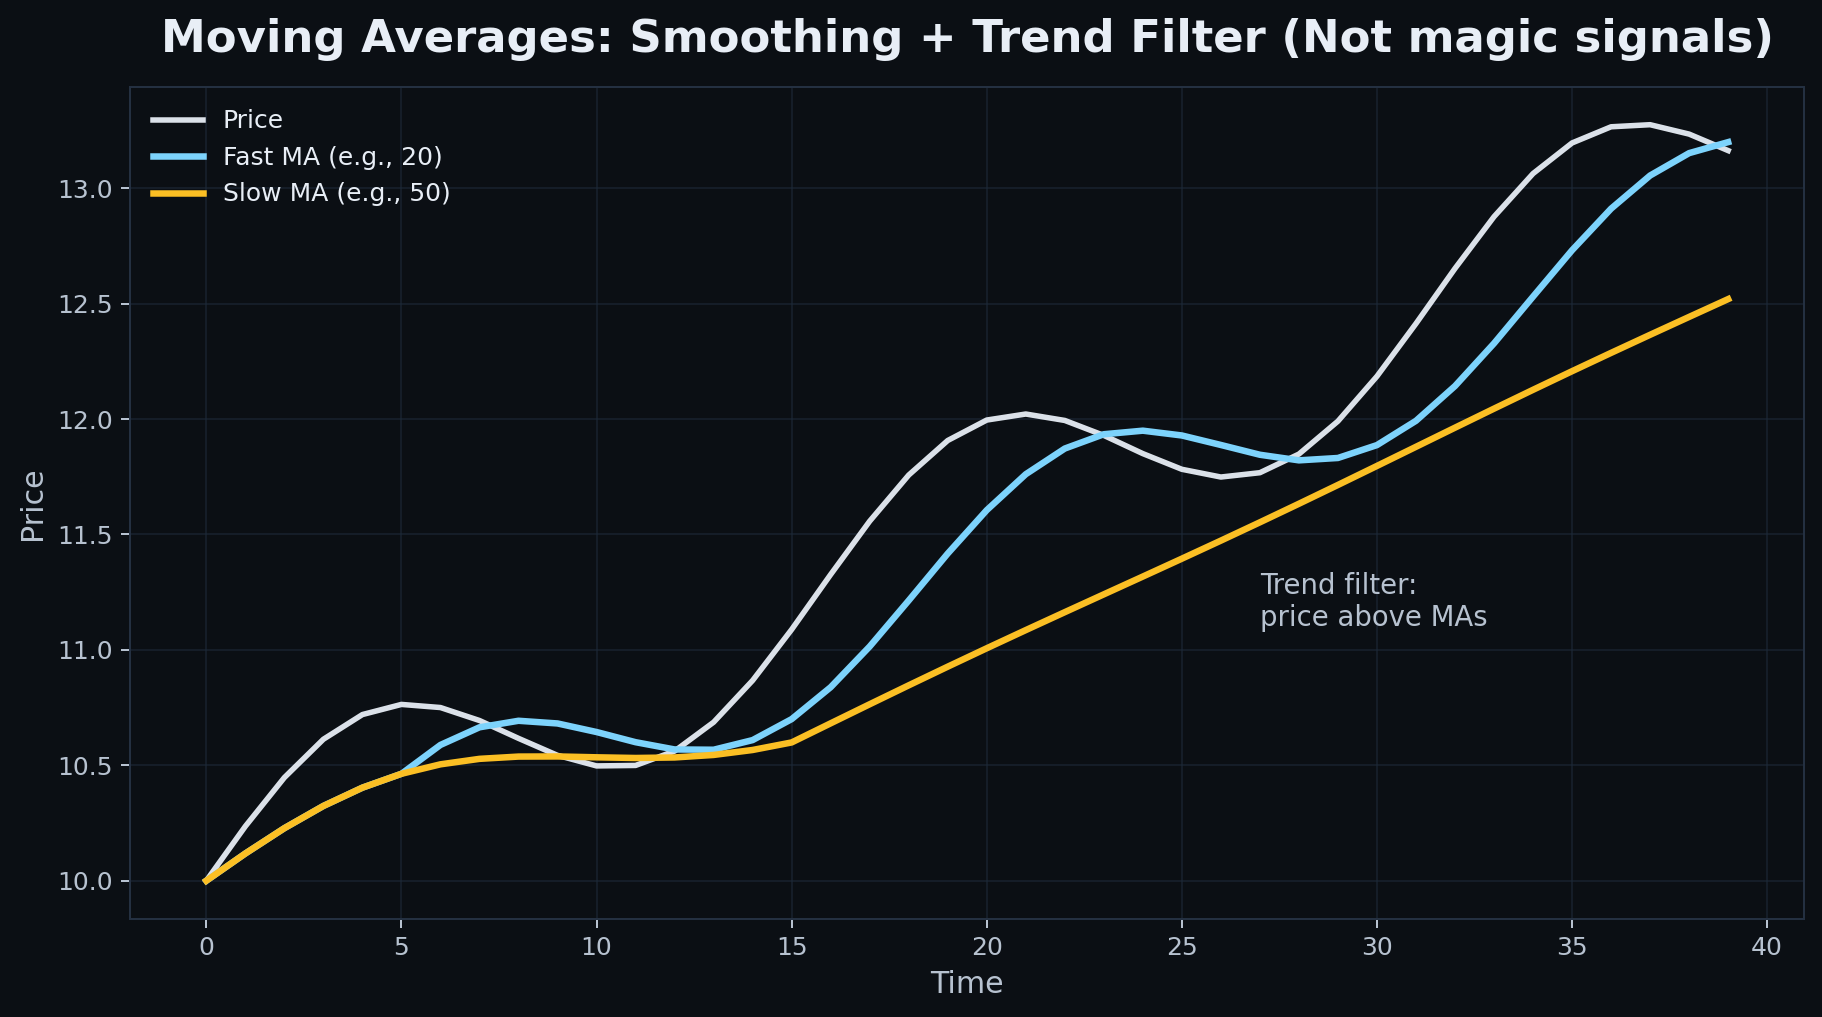
Moving Averages — Trend, Structure and Context
How moving averages help define trend regime, dynamic support and resistance, and chart context without being used as blind signals.
Read ↗
Volume and Price Action — Participation, Confirmation and Conviction
How traders use volume to confirm breakouts, continuation moves and reversals by understanding participation rather than treating volume spikes as signals.
Read ↗

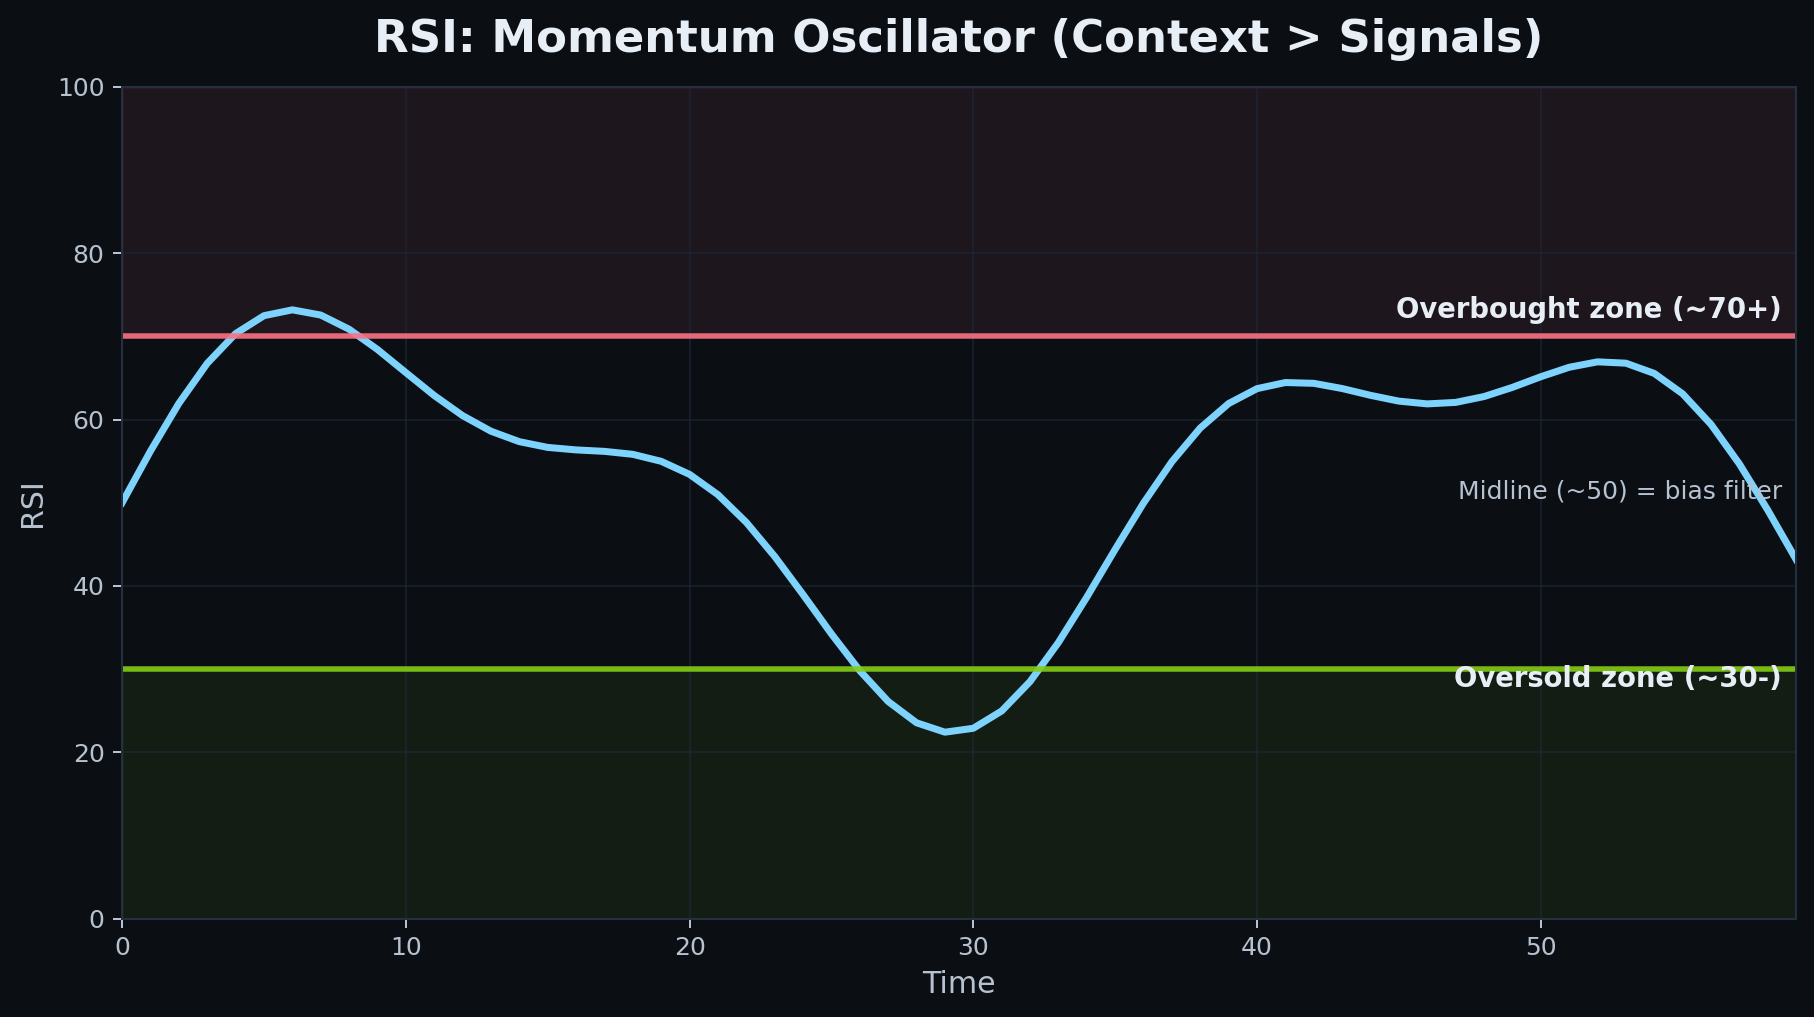
RSI Explained — Momentum, Context and Range Shifts
How traders use RSI to read momentum, trend ranges and divergence without treating overbought and oversold labels as automatic signals.
Read ↗
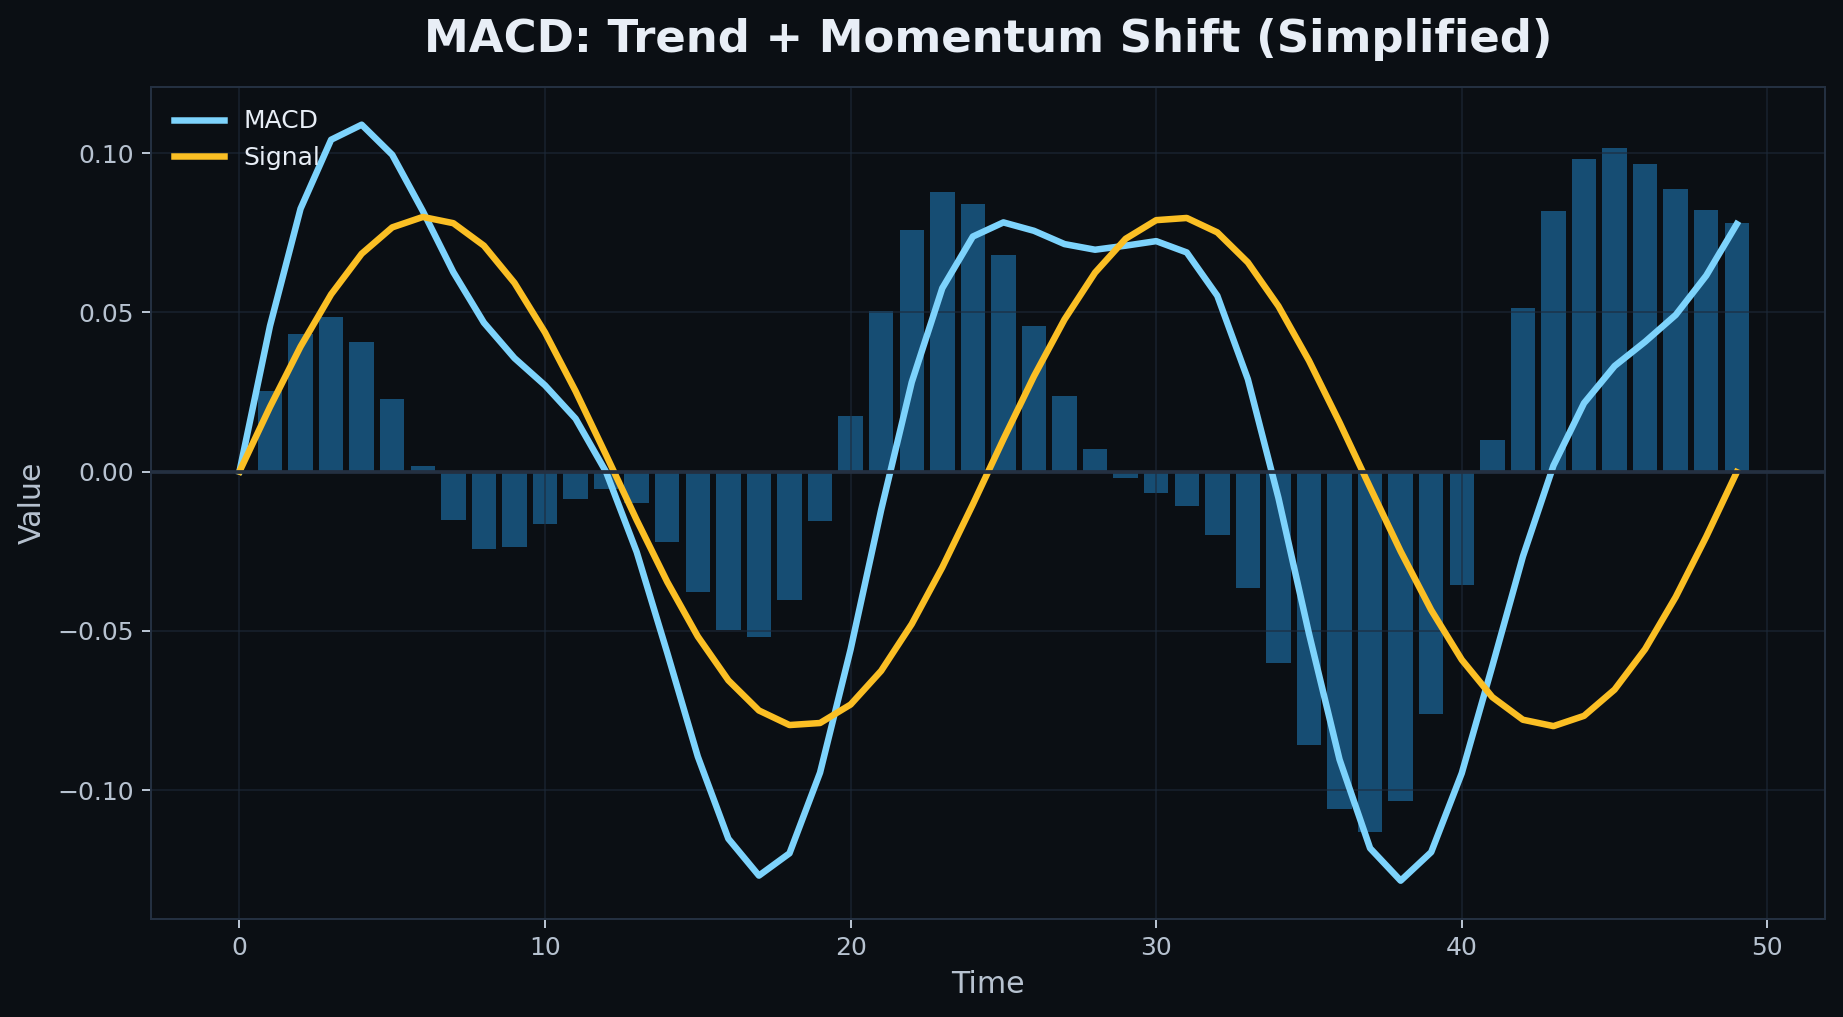
MACD Explained — Trend, Momentum and Confirmation
How traders use MACD to read momentum shifts, trend transitions and confirmation without treating every crossover as a stand-alone signal.
Read ↗
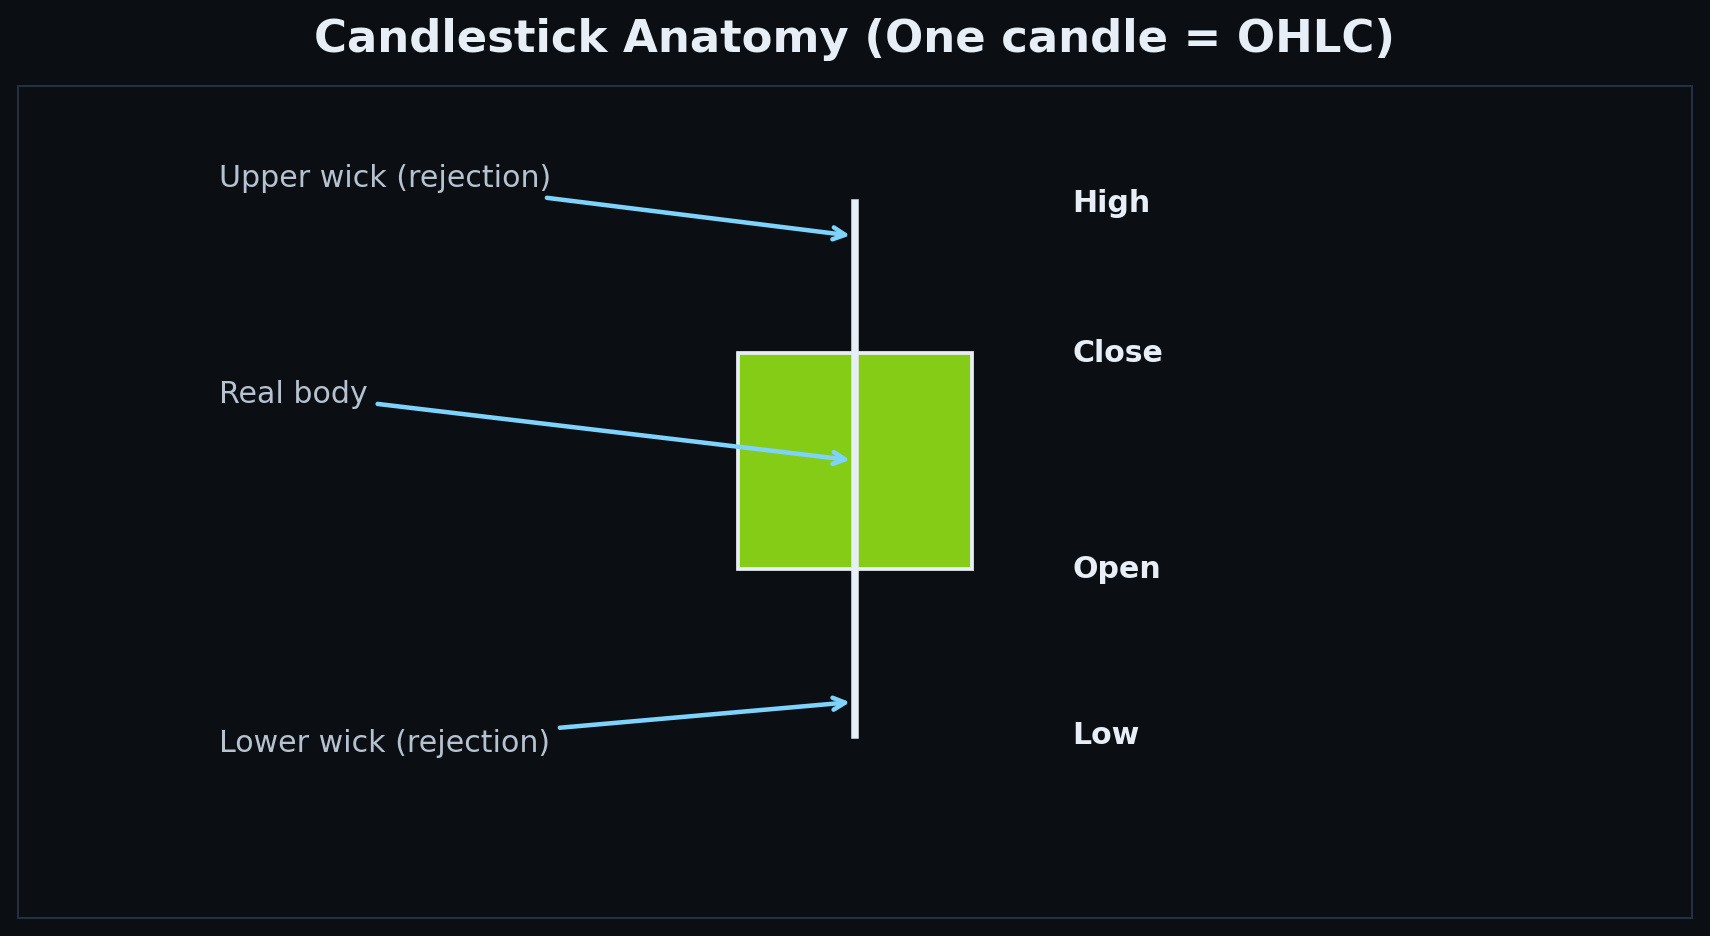
Candlesticks for Structure — Reading Acceptance and Rejection
How traders use candlesticks to read acceptance, rejection and structural context instead of memorizing endless pattern names.
Read ↗
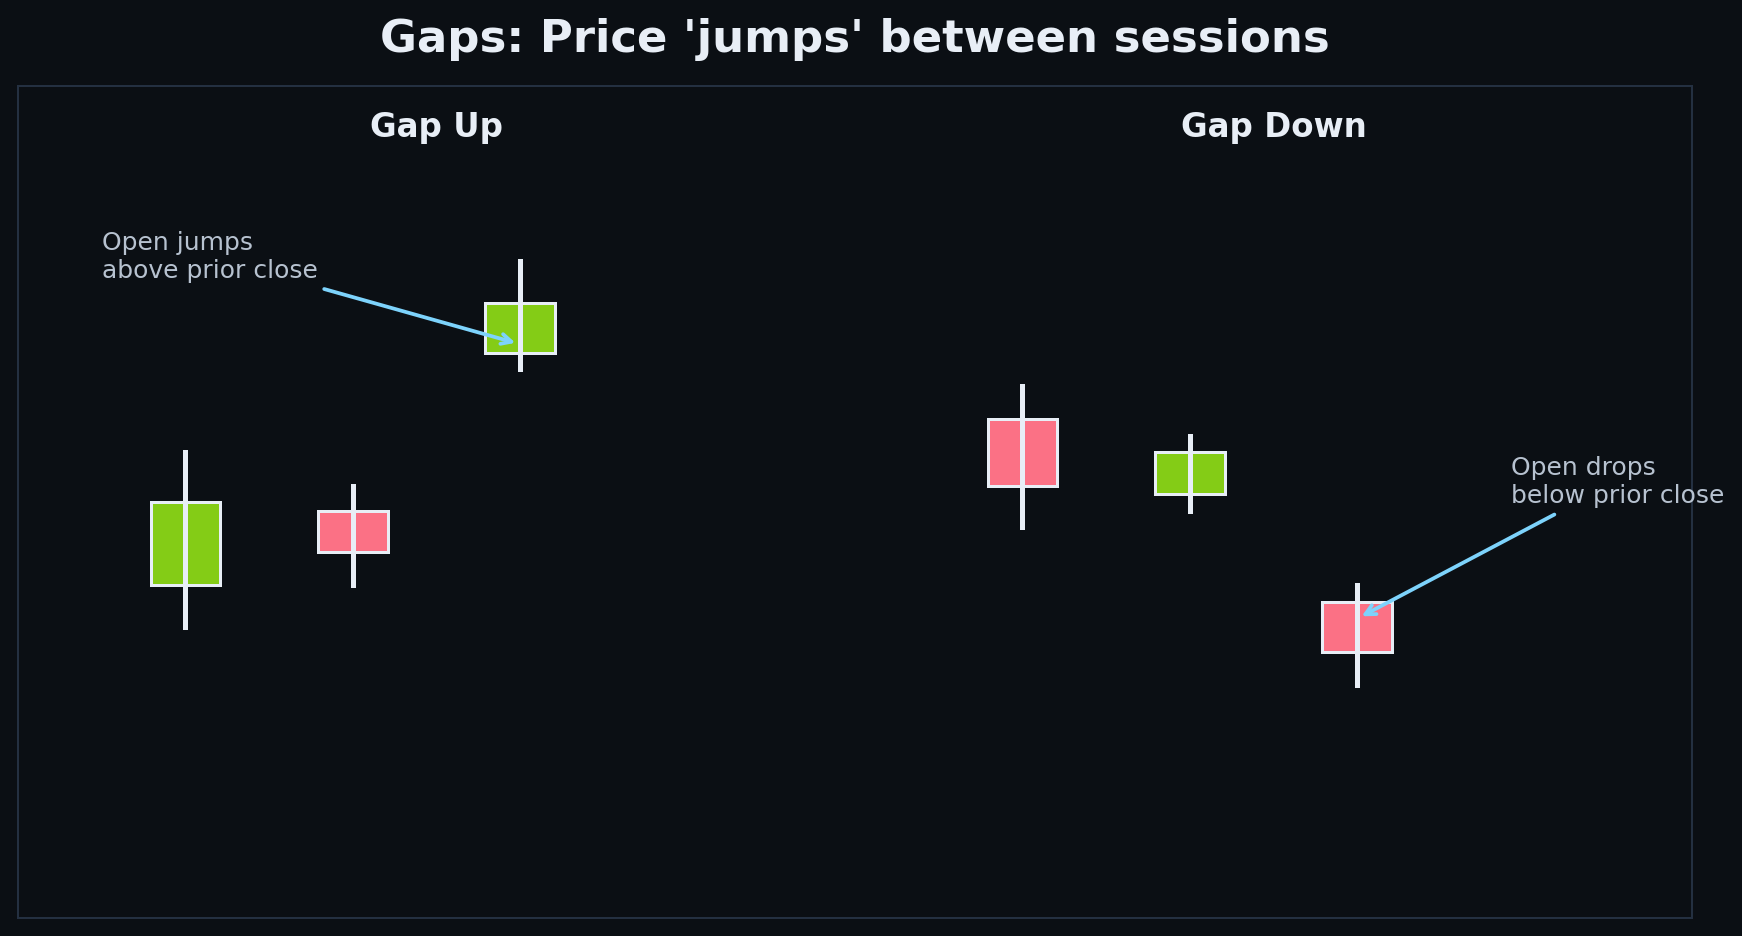
Gaps Explained — Imbalance, Reaction and Context
How traders interpret gaps as price imbalances, why they often behave like zones, and how gap holds, fills and failures change the chart narrative.
Read ↗
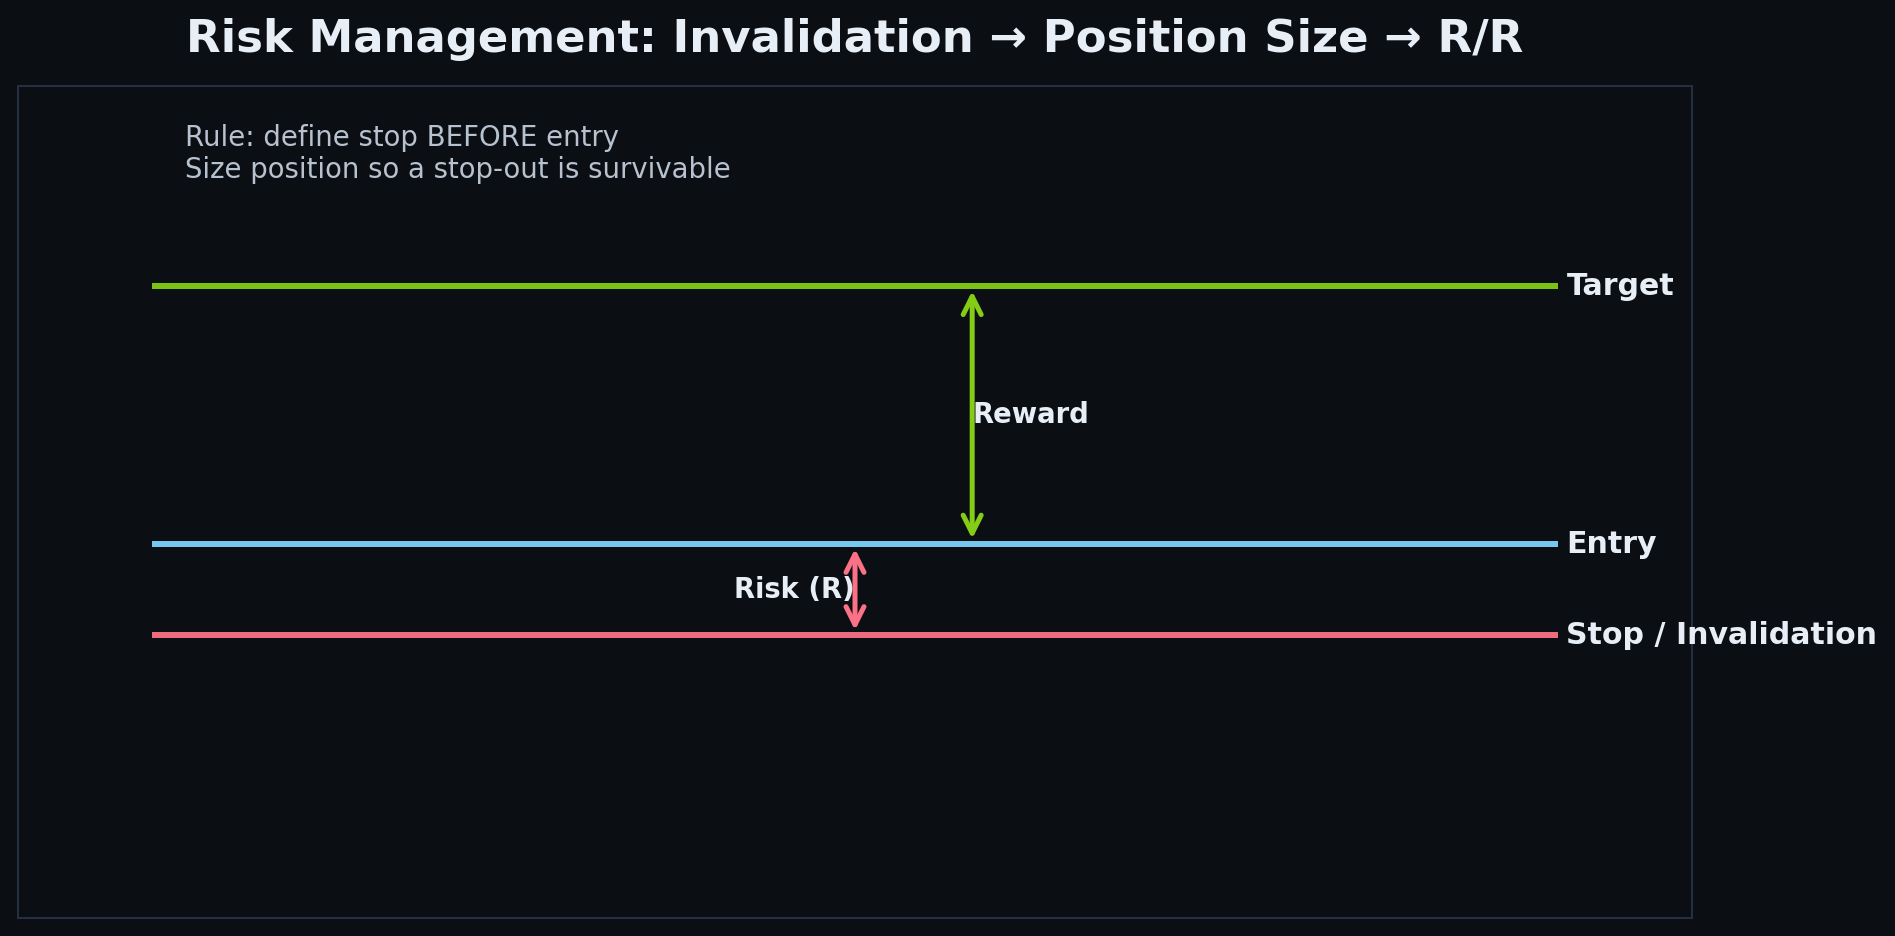
Risk Management — Protecting Capital First
A practical guide to position sizing, stop placement, risk-to-reward and expectancy so traders can survive losing streaks and compound good decisions over time.
Read ↗
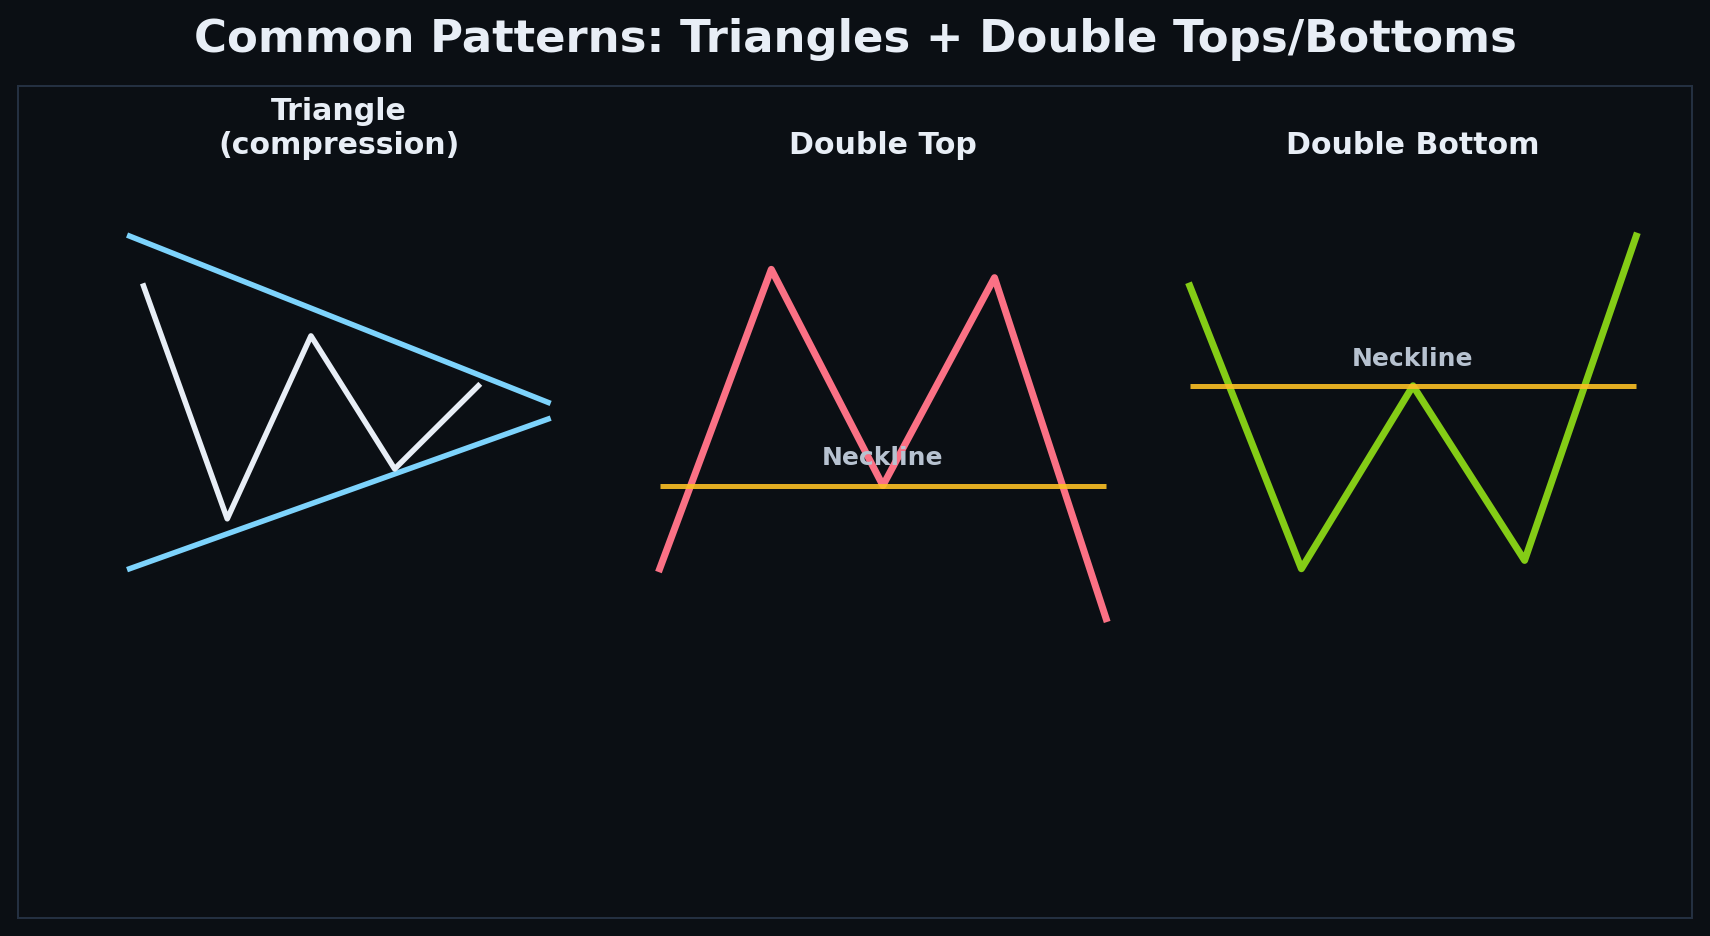
Technical Patterns Explained — Structures, Behavior and Breakouts
How traders evaluate chart patterns such as triangles, ranges and reversal structures and distinguish real setups from random shapes.
Read ↗
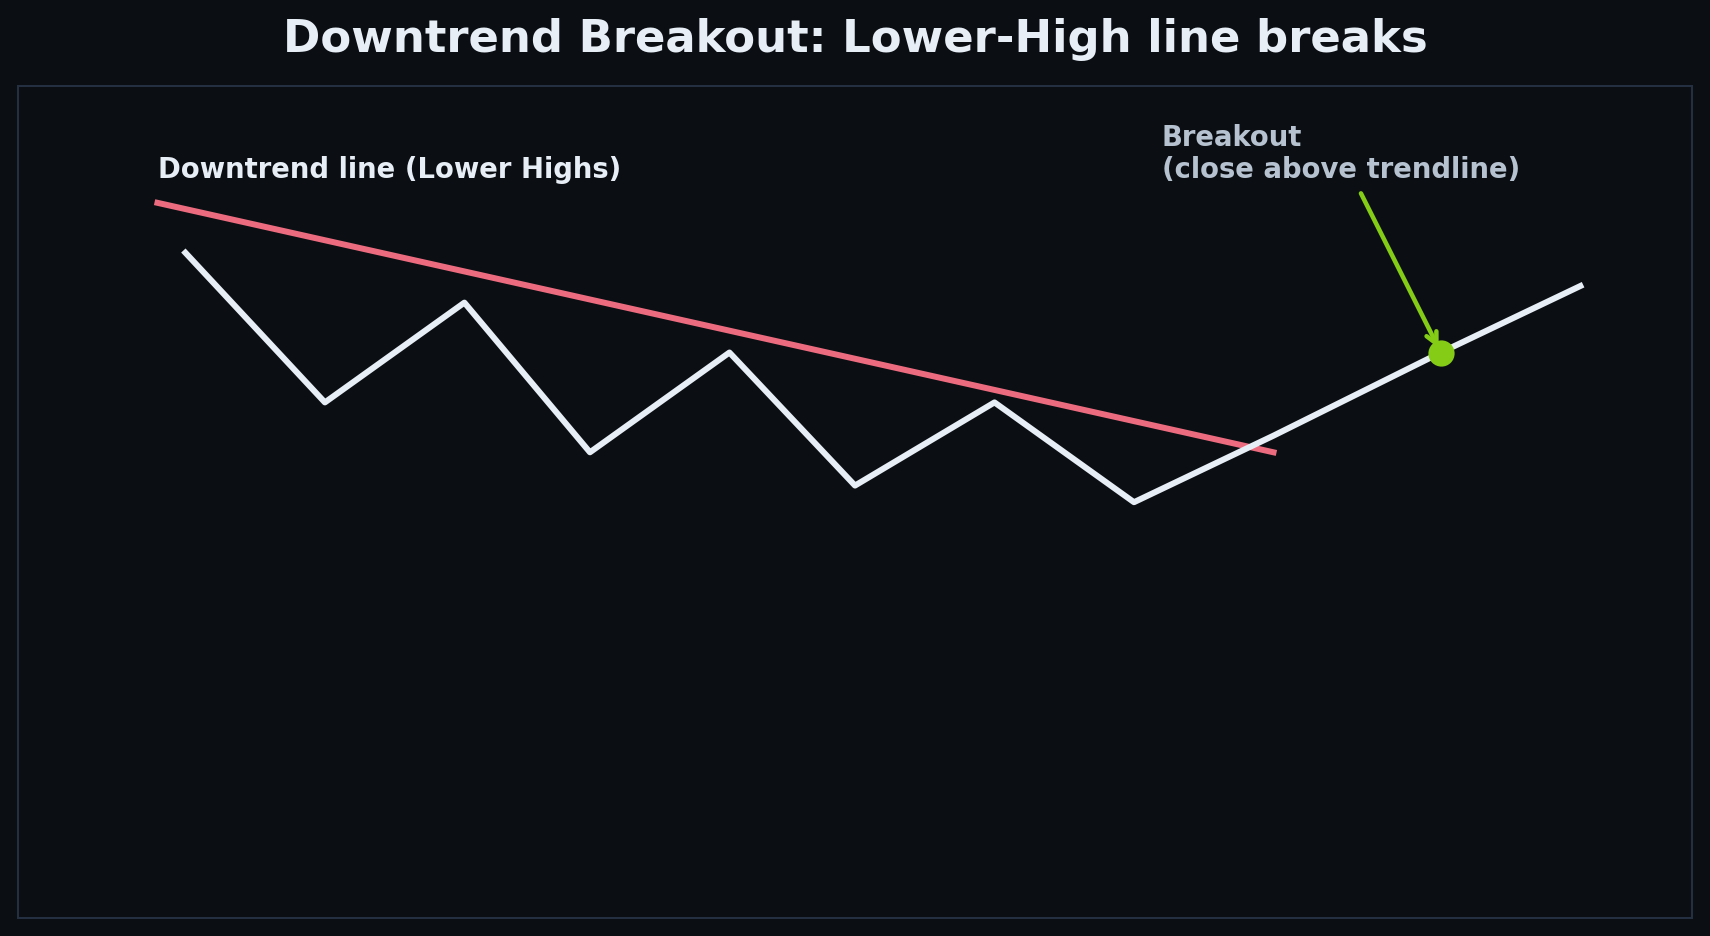
Downtrend Breakouts — Structure Shift and Acceptance
How traders evaluate breaks of falling structures and distinguish early structural shifts from late and weak breakouts.
Read ↗
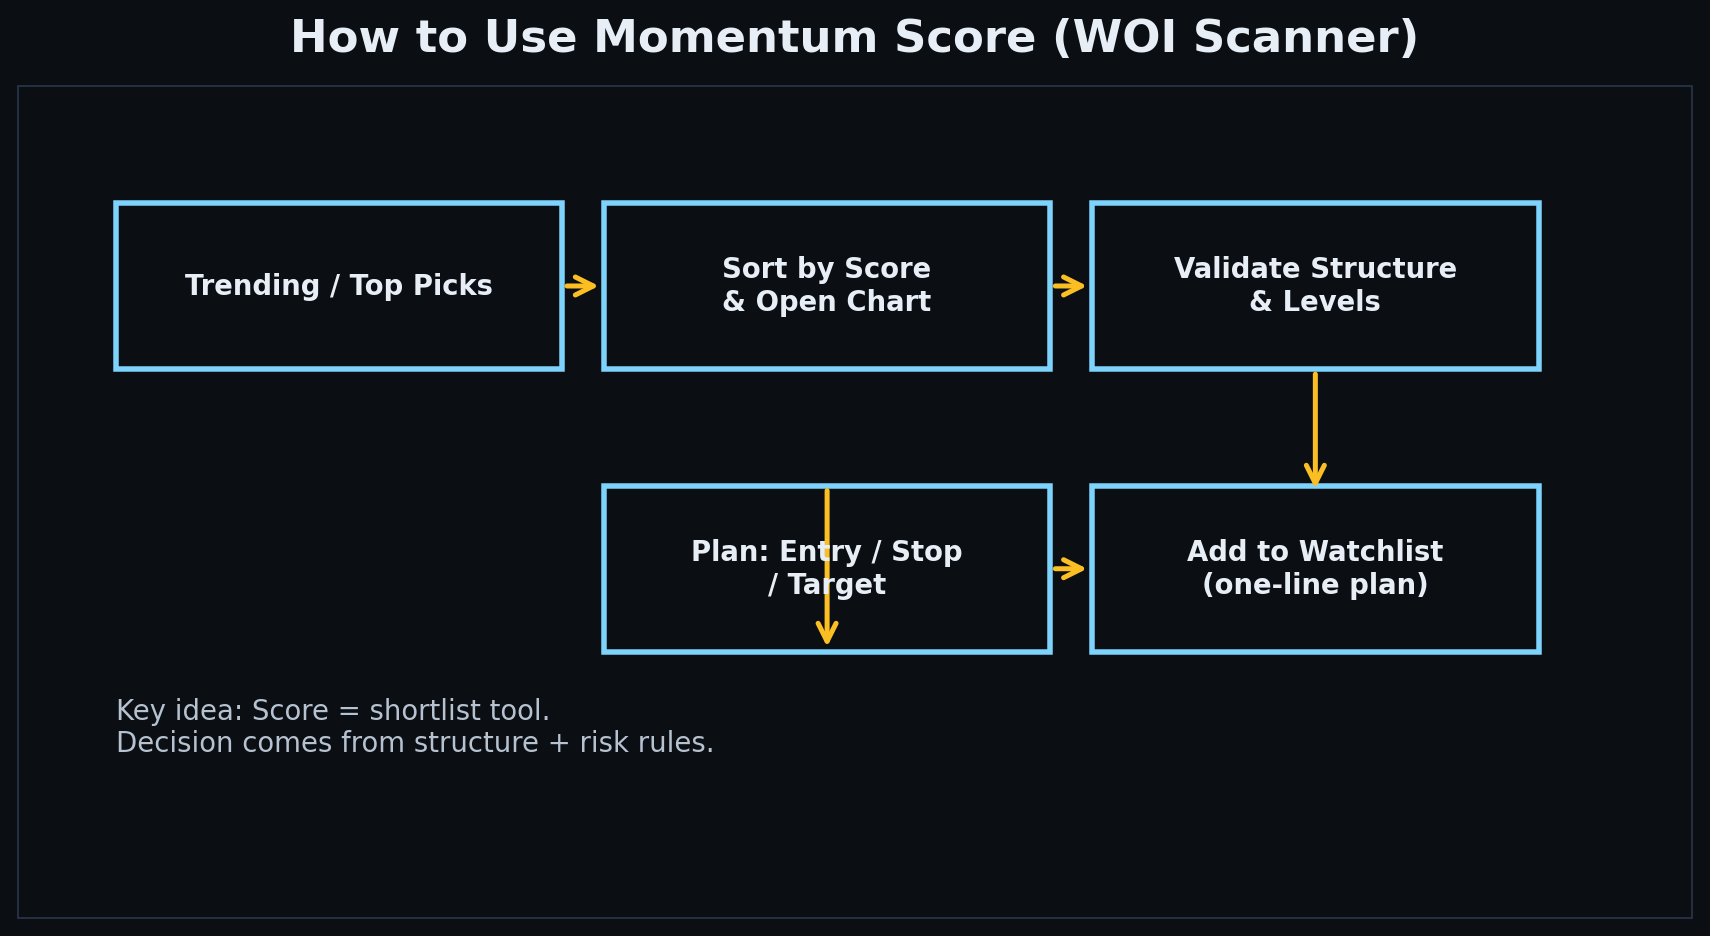
Momentum Score Explained (WOI Scanner)
How WOI momentum scoring helps prioritize charts and why it should be used as a filter rather than a signal.
Read ↗
Suggested path if you're new:
Basics → Regimes → Levels → Structure → Breakouts/Pullbacks → Risk.
Then use WOI Scanner to practice by opening charts and writing a one-line plan with an invalidation level.
Disclaimer: Educational content only. Not financial advice.