WOI Guides
MACD Explained — Trend, Momentum and Confirmation
How traders use MACD to read momentum shifts, trend transitions and confirmation without treating every crossover as a stand-alone signal.
In this guide
What MACD is actually measuring
MACD is built from moving averages, which means it reflects both trend direction and momentum change at the same time. Rather than measuring value, MACD helps traders understand how quickly momentum is strengthening, weakening or changing character. Because it is based on the relationship between averages, it often reacts more to the quality of a move than to one isolated candle. This makes it useful for reading transitions, acceleration and loss of momentum, especially when combined with structure on the chart.
- MACD reflects both trend and momentum.
- It is built from moving average relationships.
- It does not measure value or fair price.
- It helps reveal acceleration and deceleration in moves.
- MACD is most useful when read with chart structure.
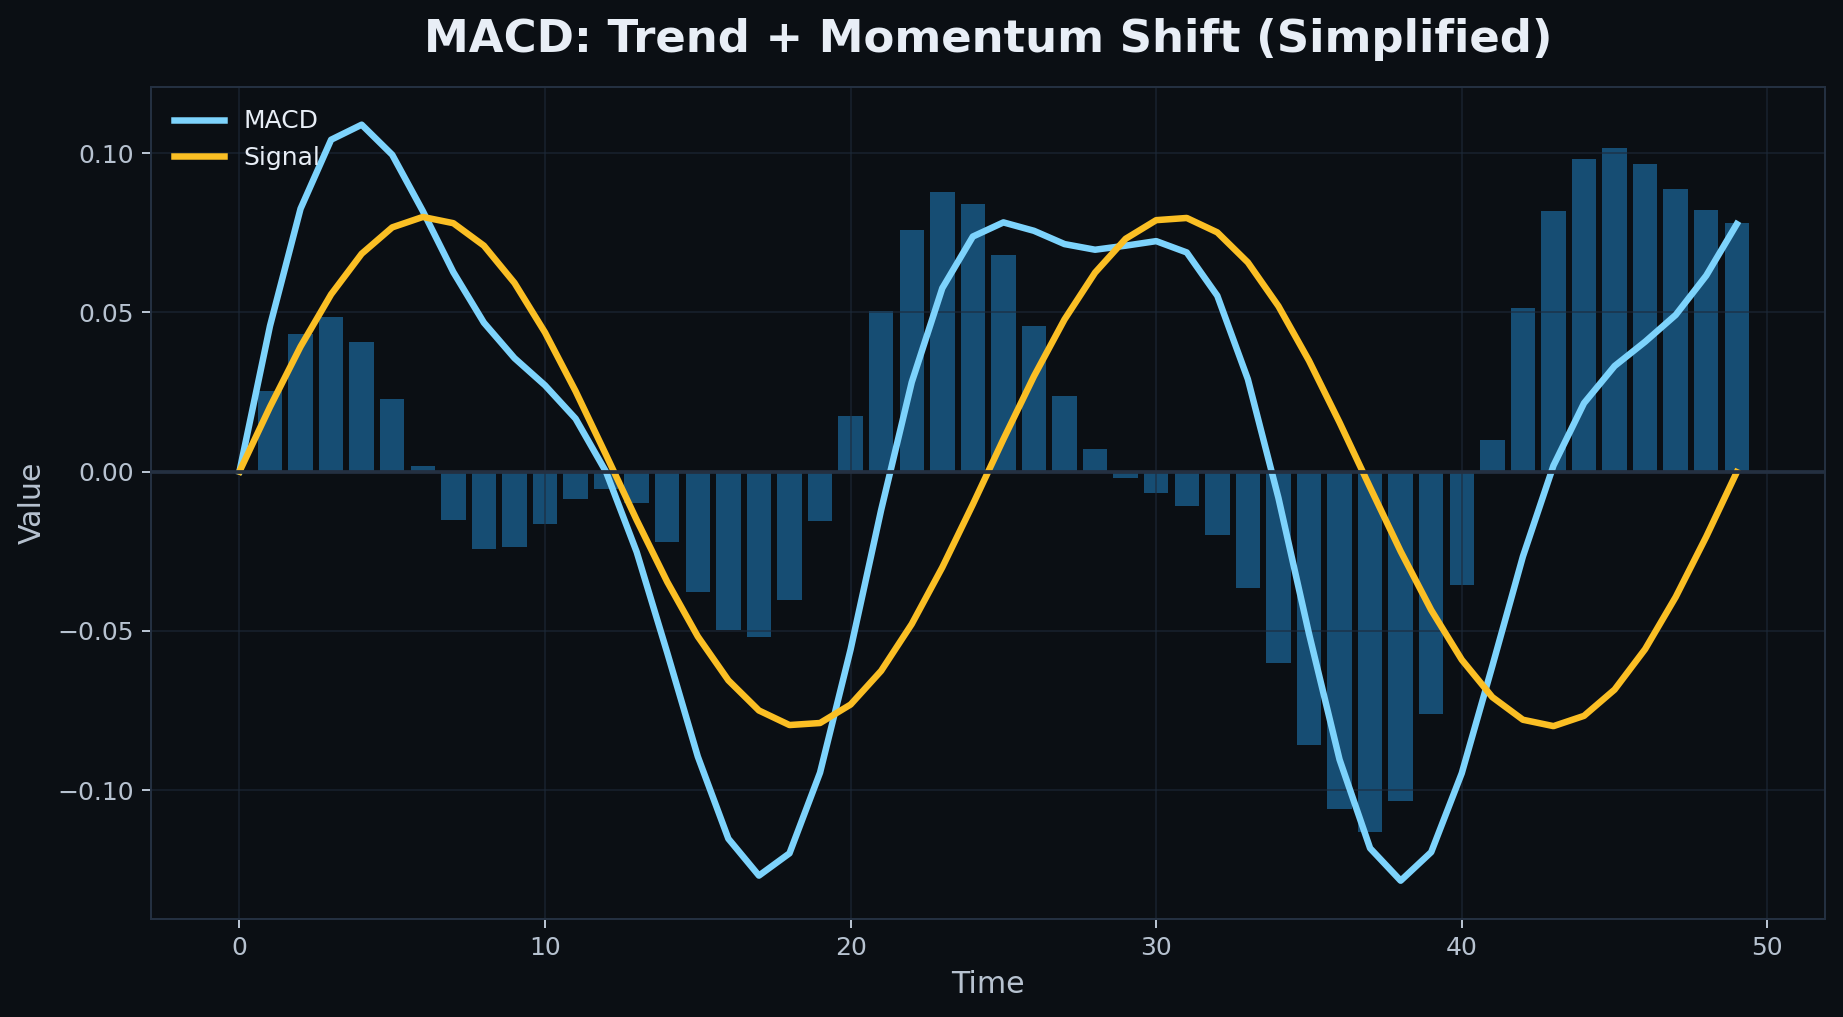
MACD line, signal line and histogram
Many traders use MACD without fully understanding its components. The MACD line shows the relationship between two moving averages. The signal line smooths that relationship and helps traders see whether short-term momentum is improving or fading. The histogram shows the distance between those two lines, which means it can reveal whether momentum is accelerating or losing force before traders focus only on the crossover itself. Each part adds context, and the full picture is usually more useful than one line alone.
- The MACD line reflects the moving average relationship.
- The signal line smooths momentum shifts.
- The histogram shows the gap between MACD and signal.
- Histogram behavior can reveal acceleration or slowdown.
- All three components are more useful together than separately.
What crossovers actually mean
MACD crossovers are popular because they appear simple, but they are often misunderstood. A bullish crossover can suggest that downside momentum is fading and upside momentum is improving. A bearish crossover can suggest the opposite. However, a crossover is not a complete trade signal by itself. In strong trends it may confirm continuation after a pullback. In choppy markets it may create repeated false signals. This is why traders should treat MACD crosses as momentum events, not automatic entries.
- A bullish crossover can suggest improving momentum.
- A bearish crossover can suggest weakening momentum.
- Crossovers are momentum events, not guaranteed entries.
- Trend context affects how useful a crossover is.
- Choppy markets often create noisy crossover signals.
Why the histogram matters
The histogram is often the most underused part of MACD. When the histogram expands, momentum is often accelerating in the current direction. When it contracts, momentum may be slowing even if price has not clearly reversed yet. This can help traders spot early signs of strengthening continuation or fading impulse. The histogram does not predict turning points perfectly, but it can help show whether the current move is gaining force, losing force or simply stabilizing after a strong push.
- Expanding histogram often signals momentum acceleration.
- Contracting histogram can signal fading momentum.
- Histogram changes may appear before obvious price reversals.
- It helps traders judge whether a move is strengthening or tiring.
- The histogram supports momentum interpretation, not certainty.
MACD in trends vs ranges
MACD usually works better in trending environments than in sideways ones. In trends, momentum shifts often matter because price is already moving with directional intent. A positive MACD turn after a pullback in an uptrend can support continuation analysis. In ranges, however, MACD often flips back and forth with little real edge because price itself is not moving with sustained control. Understanding this difference helps traders stop overusing MACD when the chart is structurally noisy.
- MACD tends to work better in trends than in ranges.
- Trend pullbacks often produce more meaningful momentum shifts.
- Range-bound charts can create frequent false signals.
- Market regime changes MACD reliability.
- Structure should always be checked before trusting the indicator.
MACD divergence
Like RSI, MACD can also show divergence when price and momentum no longer fully agree. Bullish divergence appears when price pushes to a lower low while MACD or its histogram forms a higher low, suggesting downside momentum may be weakening. Bearish divergence appears when price makes a higher high while MACD momentum fails to confirm. Divergence can be useful, but it should be treated as a warning rather than as a complete setup. Its value improves when it appears near meaningful support, resistance or exhaustion structure.
- Bullish divergence can suggest weakening downside momentum.
- Bearish divergence can suggest weakening upside momentum.
- Divergence is a warning, not a trade by itself.
- Location matters when interpreting divergence.
- Price structure still needs to confirm the idea.
MACD as confirmation, not prediction
One of the most practical ways to use MACD is as a confirmation tool. Traders may look at whether MACD is improving into a breakout, whether the histogram is re-expanding during a continuation setup, or whether momentum is fading while price approaches resistance. In this role, MACD helps strengthen or weaken a chart thesis rather than create one from nothing. This usually leads to better decisions than treating the indicator as a stand-alone system that must always produce a buy or sell answer.
- MACD works well as a confirmation tool.
- It can support breakout and continuation analysis.
- Momentum agreement can strengthen a structural thesis.
- Momentum conflict can weaken a setup.
- MACD should support decisions, not replace chart reading.
Common mistakes
Most MACD mistakes come from taking the indicator too literally. Traders often buy every bullish crossover in weak charts, sell every bearish crossover in strong trends, or ignore nearby support and resistance completely. Others use MACD as a timing shortcut without defining invalidation or considering whether the market is trending or ranging. MACD becomes much more useful once traders stop demanding a simple signal from it and start using it as a context and momentum tool.
- Trading every crossover without context.
- Ignoring support and resistance when MACD shifts.
- Using MACD as a timing shortcut without invalidation.
- Trusting MACD too much in range-bound markets.
- Forgetting that structure still comes first.
How WOI Scanner uses MACD context
The WOI Scanner uses MACD as part of the broader technical narrative rather than as a stand-alone trigger. MACD context can help show whether momentum is improving into a breakout, whether continuation energy is returning after a pullback, or whether price structure is losing momentum near an important area. The point is not to reduce the chart to one indicator. The point is to combine MACD with structure, levels and behavior so the analysis becomes more grounded and useful.
- MACD helps enrich momentum context in the scanner.
- It supports breakout and continuation interpretation.
- Momentum behavior adds depth to the technical narrative.
- The scanner uses MACD as one input, not the whole decision.
- Structure and levels remain the primary framework.
Checklist
Before using MACD in a trade idea, it helps to pause and ask whether momentum is actually supporting the structure on the chart or whether you are just reacting to an indicator event. That distinction often separates useful MACD analysis from noisy overtrading.
- Is the chart trending or ranging?
- Is MACD improving into a meaningful technical area?
- Is the histogram expanding or contracting?
- Does price structure agree with the MACD message?
- Is there nearby support or resistance that changes the setup?
- What invalidates the idea beyond the indicator itself?
Apply this in WOI
Open the scanner, pick one symbol, and practice:
mark zones, decide trend regime, and write one invalidation level.
The goal is a repeatable process, not perfect predictions.
Disclaimer: Educational content only. Not financial advice.