WOI Guides
Technical Patterns Explained — Structures, Behavior and Breakouts
How traders evaluate chart patterns such as triangles, ranges and reversal structures and distinguish real setups from random shapes.
In this guide
What chart patterns actually represent
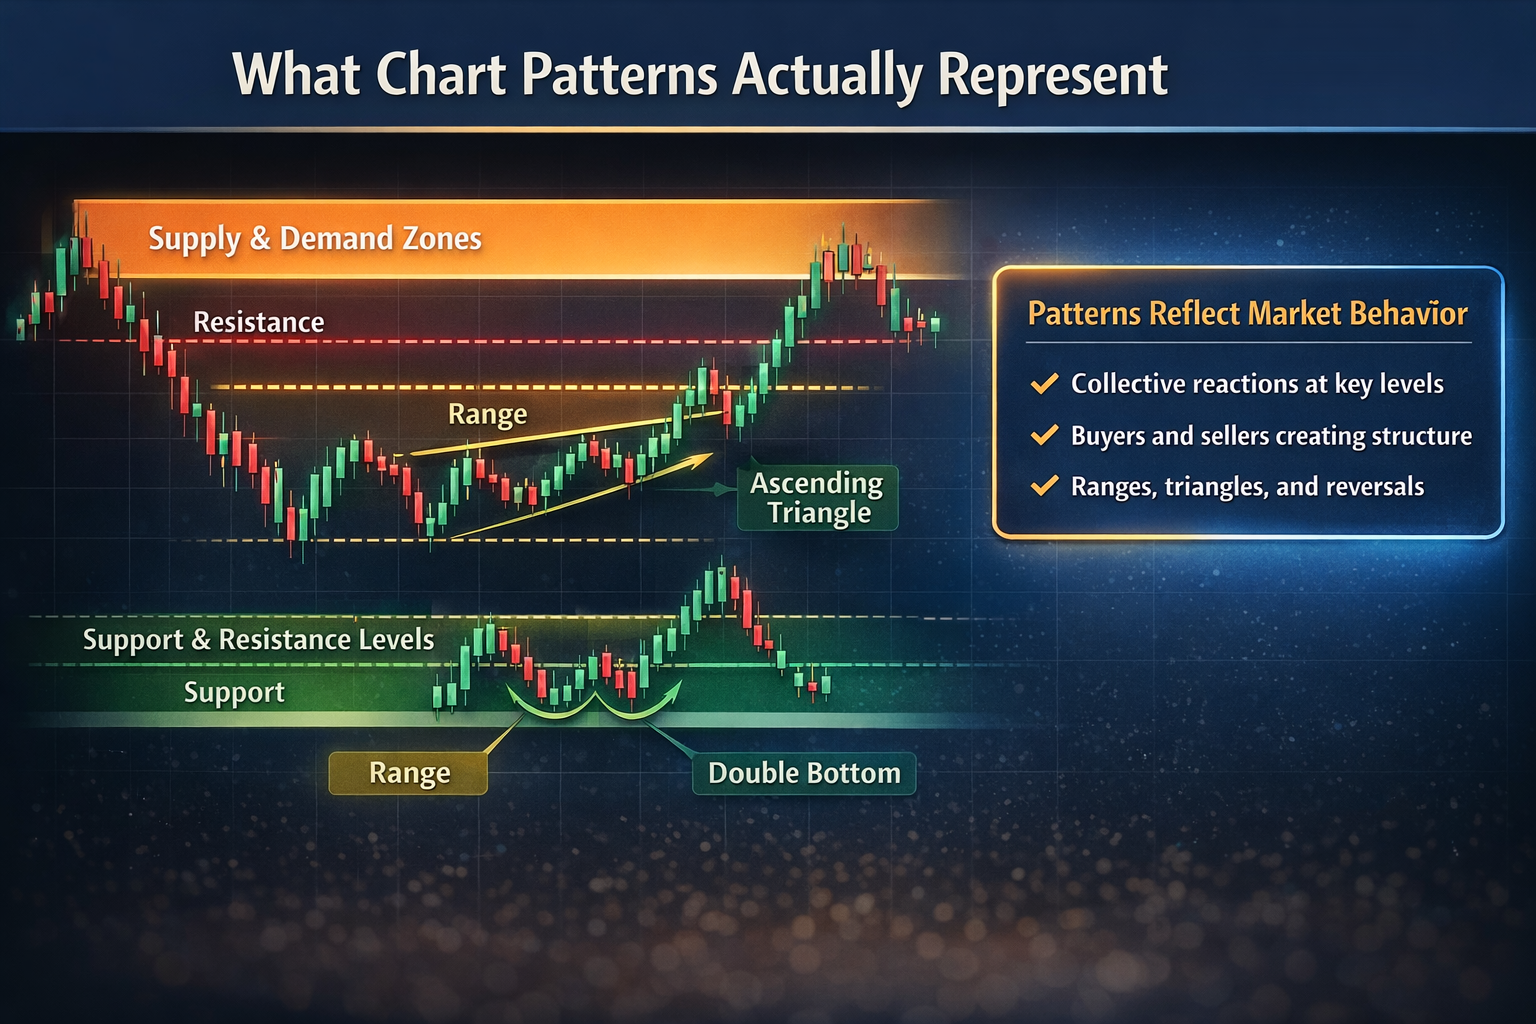
Chart patterns are not magical shapes that predict the future on their own. They are visual expressions of crowd behavior. A pattern forms because buyers and sellers repeatedly react around similar price areas, creating recognizable structures such as ranges, triangles, wedges and reversal formations. The value of a pattern comes from the behavior behind it, not from the label alone. Good traders do not just ask what the pattern is called. They ask what it says about pressure, hesitation, acceptance and potential expansion.
- Patterns represent repeated market behavior.
- They form from supply and demand interactions.
- They help organize price action into structure.
- They are context tools, not guarantees.
- Behavior matters more than naming.
Patterns are behavior, not magic
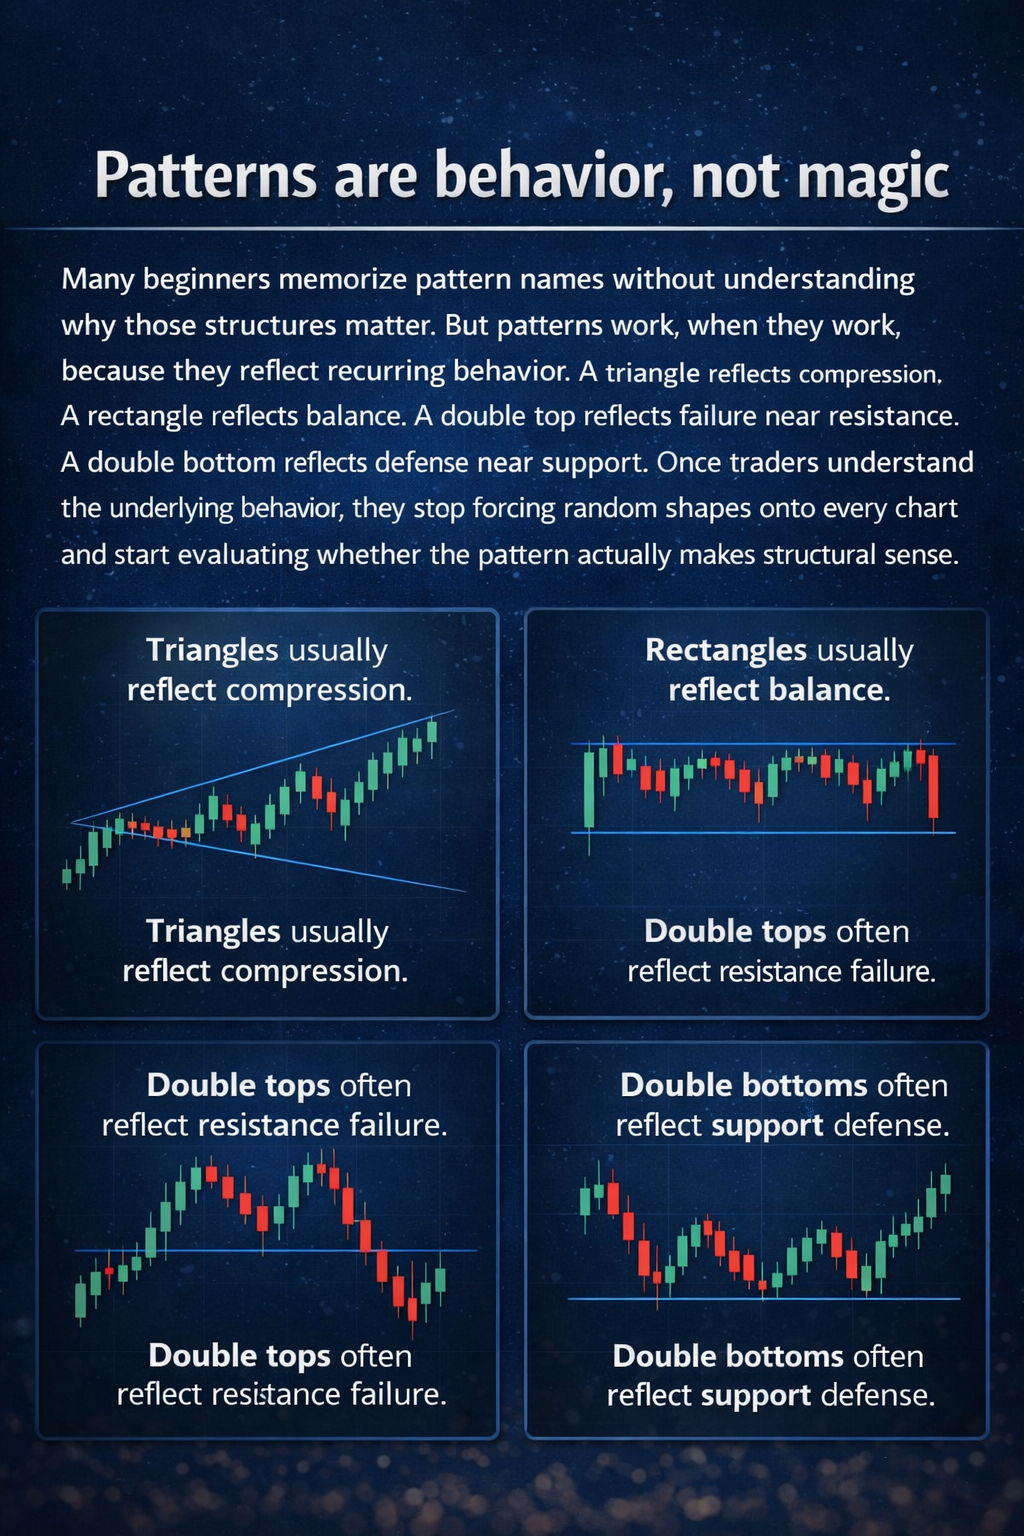
Many beginners memorize pattern names without understanding why those structures matter. But patterns work, when they work, because they reflect recurring behavior. A triangle reflects compression. A rectangle reflects balance. A double top reflects failure near resistance. A double bottom reflects defense near support. Once traders understand the underlying behavior, they stop forcing random shapes onto every chart and start evaluating whether the pattern actually makes structural sense.
- Triangles usually reflect compression.
- Rectangles usually reflect balance.
- Double tops often reflect resistance failure.
- Double bottoms often reflect support defense.
- The underlying behavior matters more than the pattern label.
Continuation vs reversal patterns
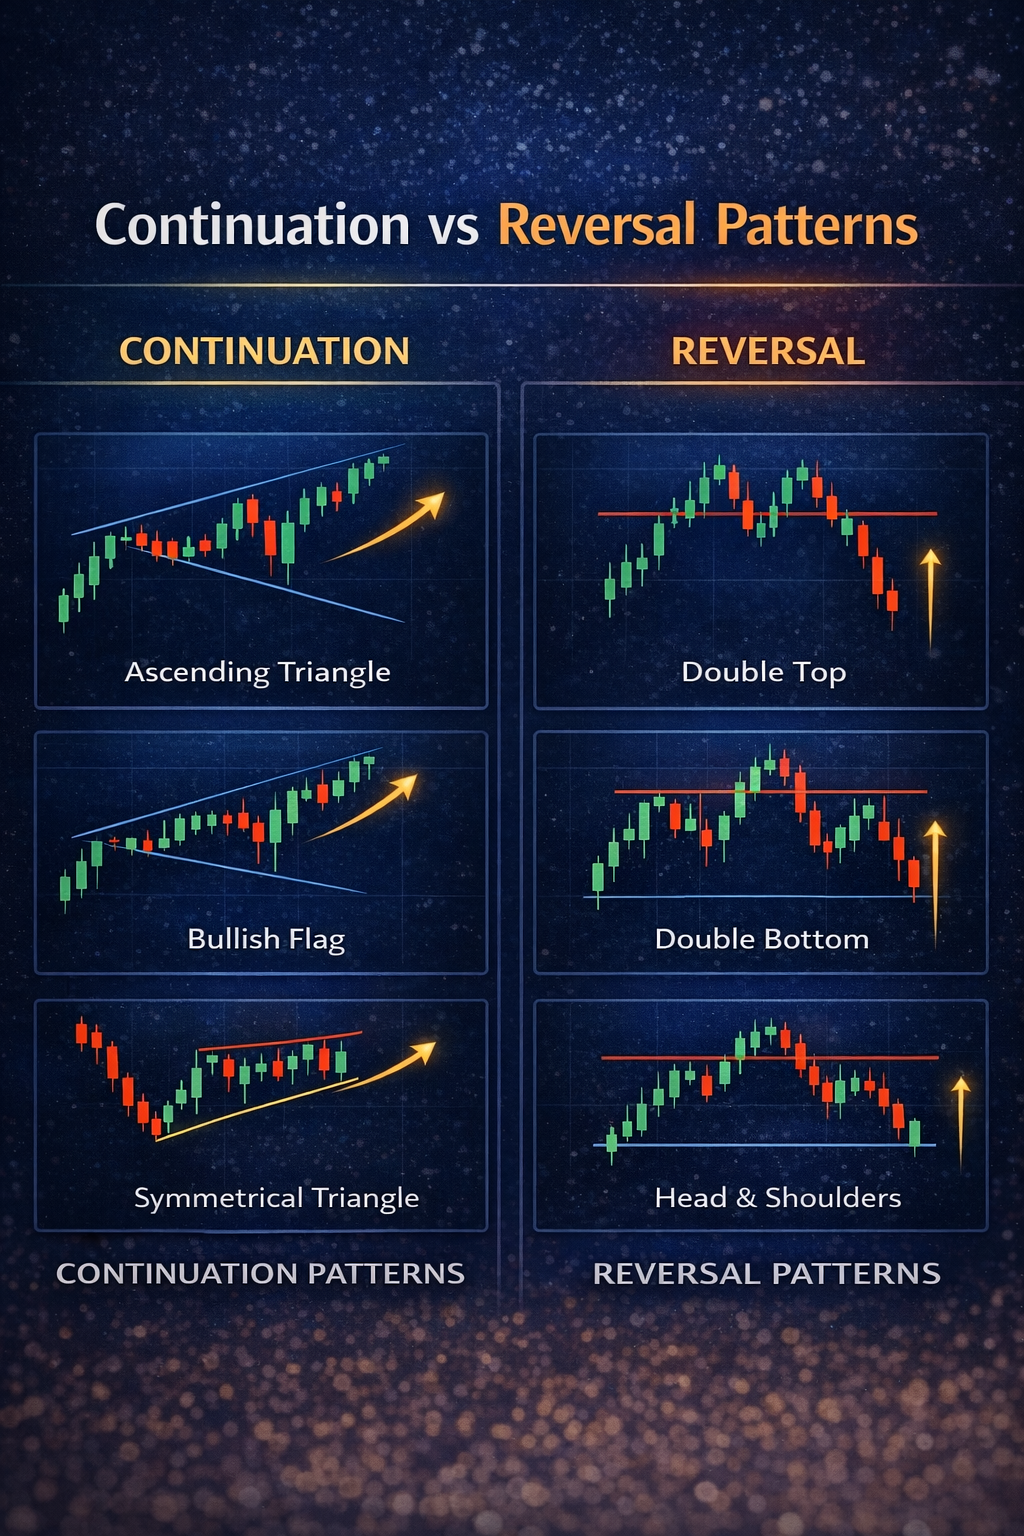
Patterns do not all mean the same thing. Some tend to appear as pauses inside a broader trend, while others appear after an extended move and may signal exhaustion or reversal. Continuation patterns usually show controlled consolidation before the existing trend resumes. Reversal patterns usually appear when the prior trend is losing momentum and the opposite side begins to push back more effectively. The same structure can behave differently depending on trend context, which is why location matters as much as shape.
- Continuation patterns often appear during trends.
- Reversal patterns often appear after extended moves.
- Context changes the meaning of the pattern.
- Location matters as much as structure.
- Trend direction should always be part of pattern analysis.
Compression patterns
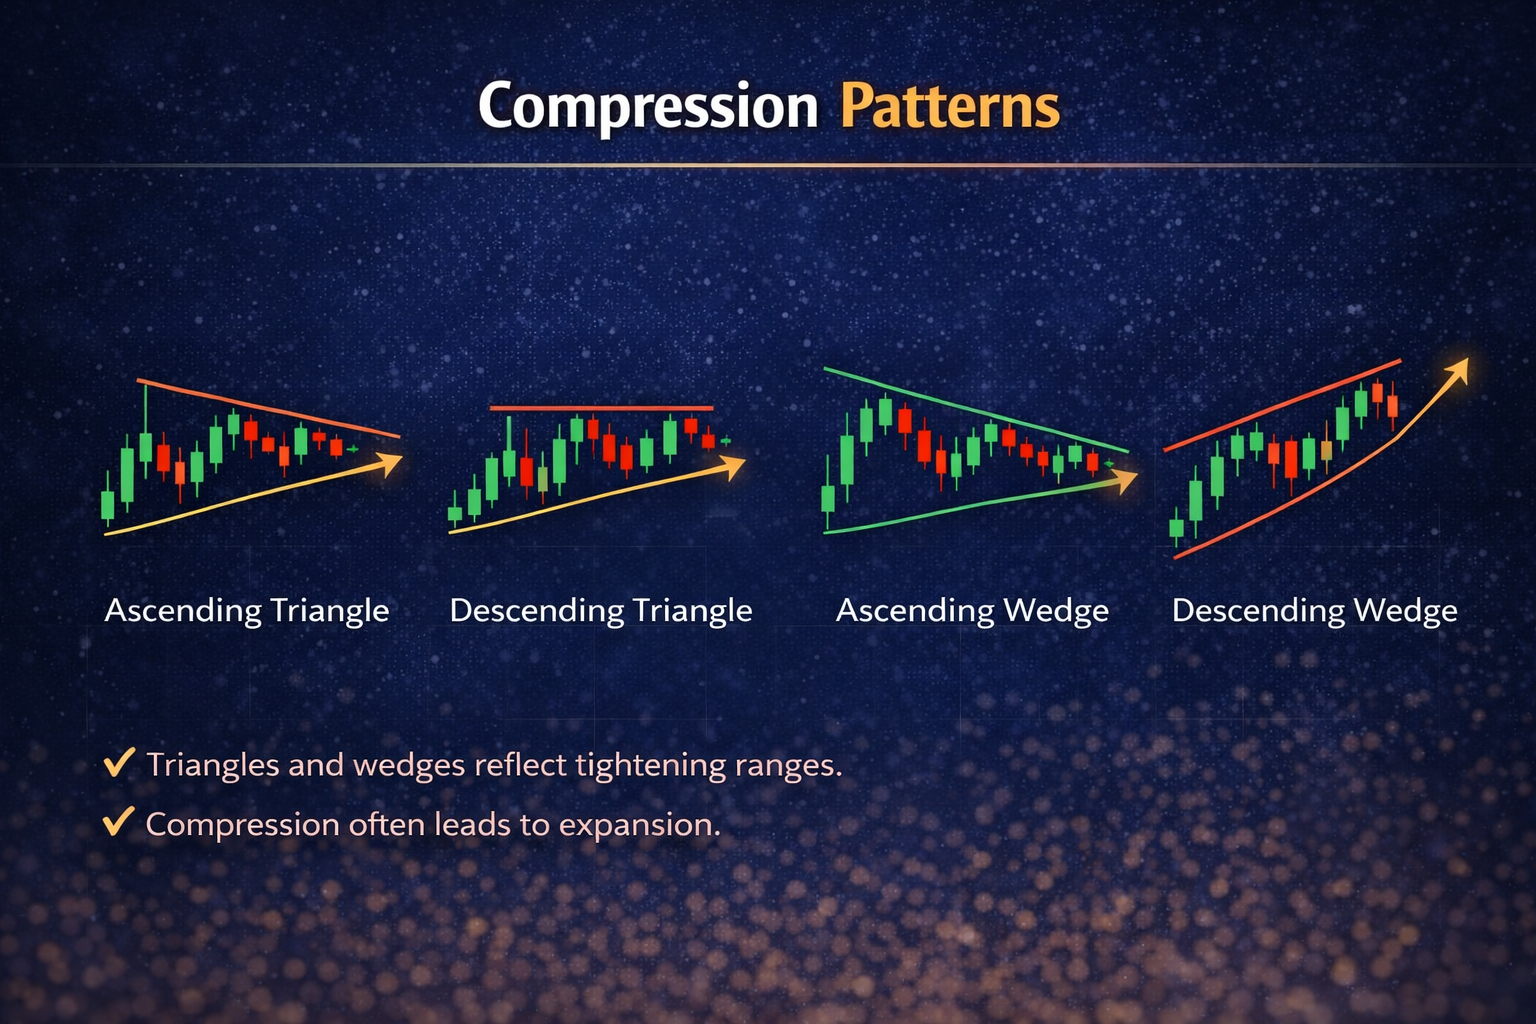
Triangles and wedges usually represent volatility contraction before a possible expansion move. The most important feature is not the pattern name but whether the swing structure is actually compressing. In a healthy compression pattern, highs become lower, lows become higher, and price action tightens into a narrower range. This shows temporary balance and reduced volatility. The eventual breakout matters, but the internal structure matters too. Clean repeated touches and visually converging swings usually make the pattern more meaningful.
- Triangles often represent price compression.
- Wedges often reflect slowing momentum or narrowing structure.
- Converging swings matter more than a rough shape.
- Multiple clean touches improve pattern quality.
- Compression often leads to expansion, but not always in the expected direction.
Ranges and rectangles
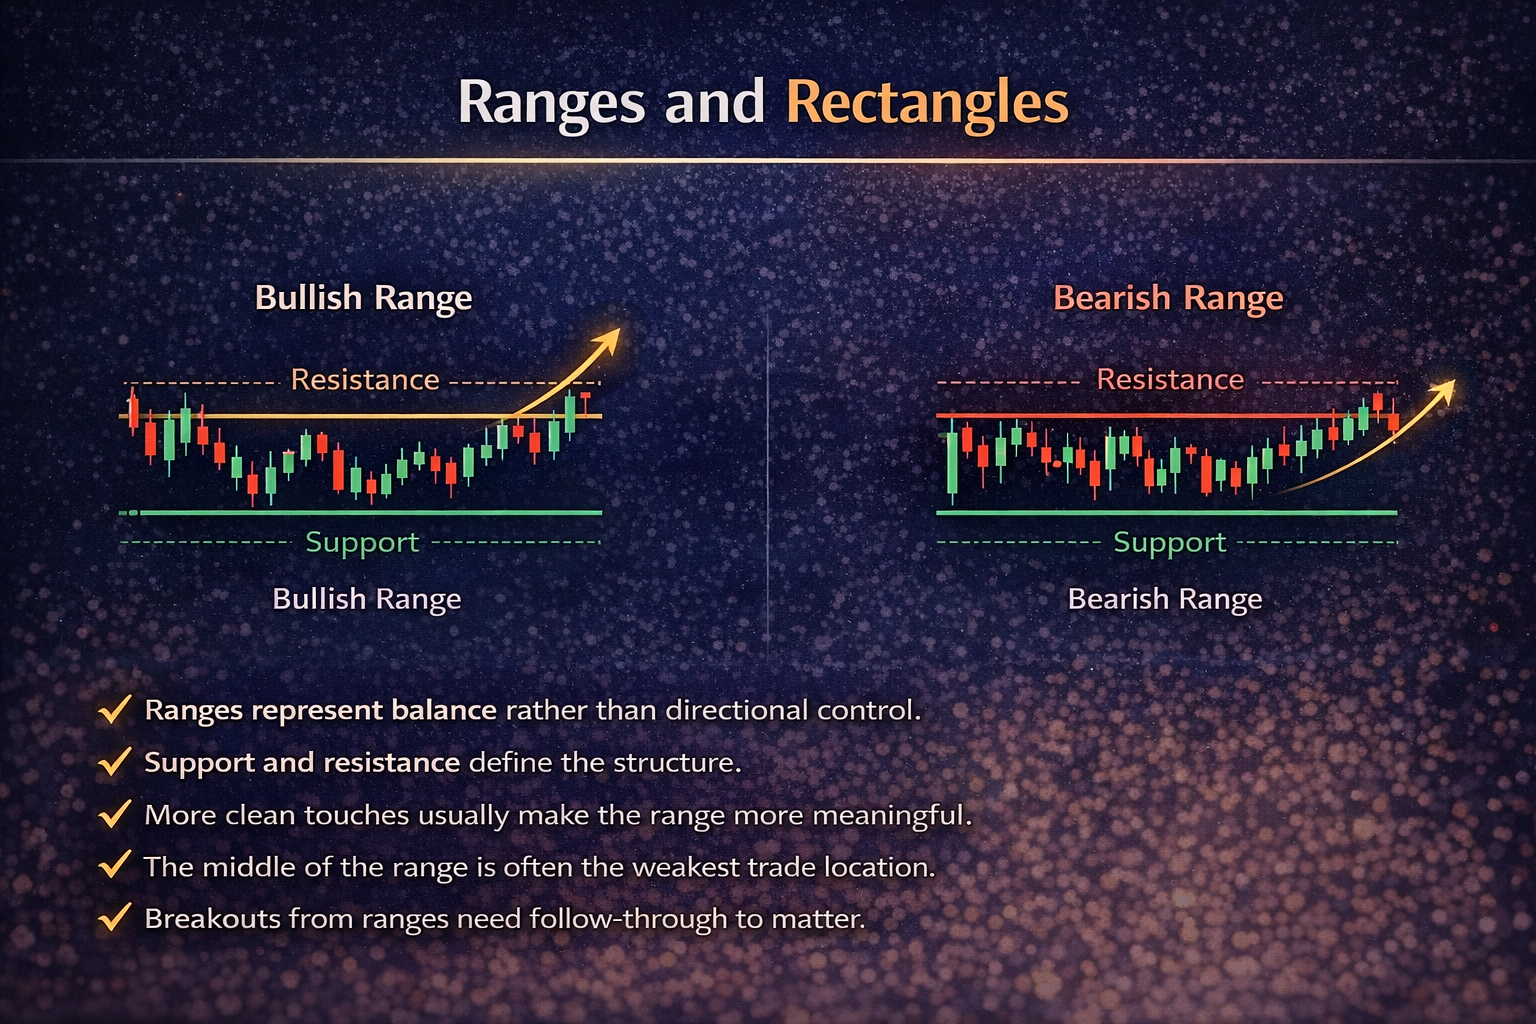
Ranges represent balance between buyers and sellers across a horizontal price band. Instead of trending, price rotates between support and resistance until one side gains control. Strong ranges usually show repeated reactions near the top and bottom of the structure. These repeated touches make the boundaries clearer and help traders define invalidation more logically. The most important part of a range is not the middle. It is the behavior near the edges, because that is where opportunity and information usually appear.
- Ranges represent balance rather than directional control.
- Support and resistance define the structure.
- More clean touches usually make the range more meaningful.
- The middle of the range is often the weakest trade location.
- Breakouts from ranges need follow-through to matter.
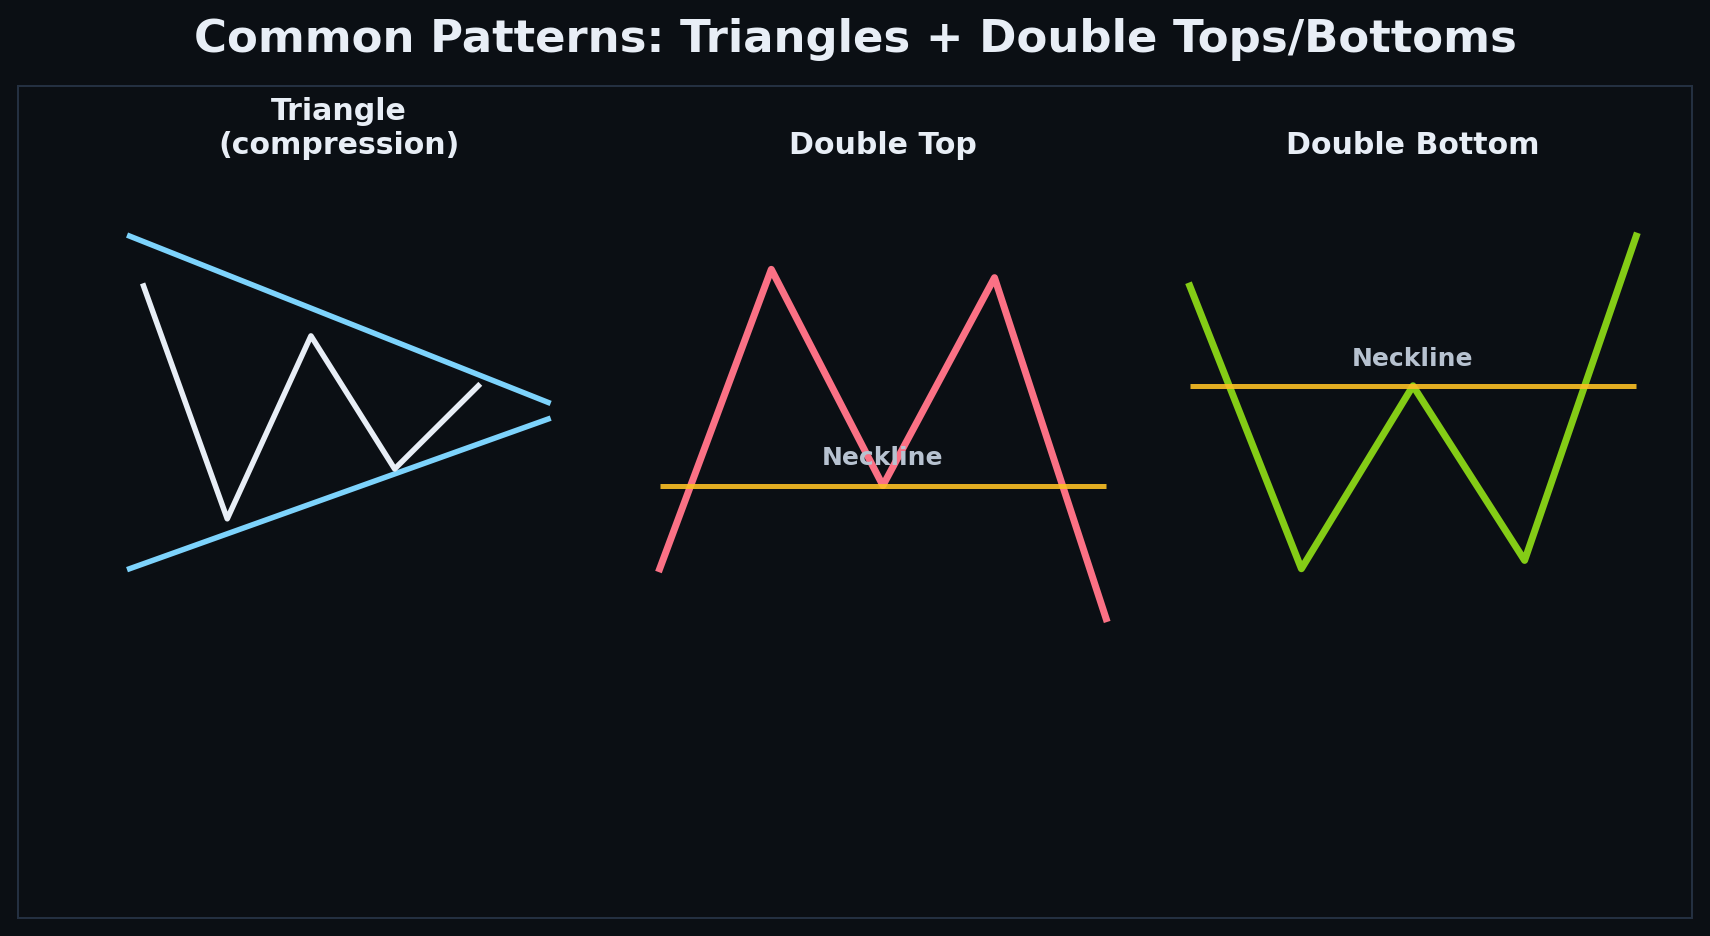
Double top and double bottom
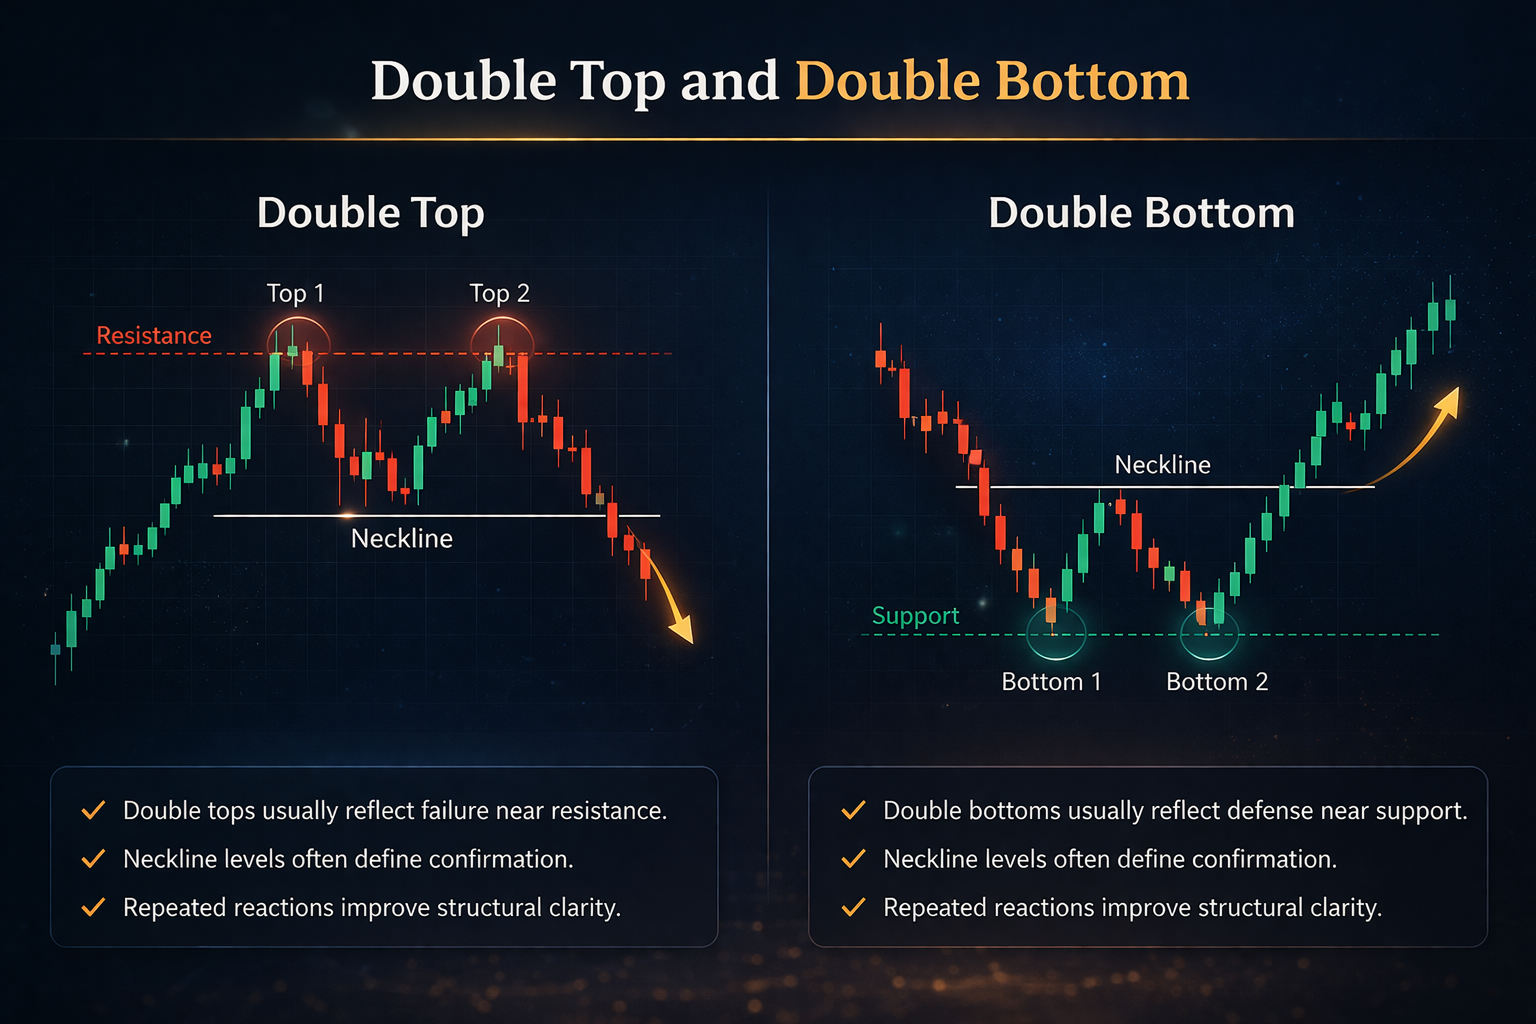
Double tops and double bottoms are classic reversal structures because they show repeated failure at an important area. A double top forms when price reaches a prior high, fails to break through convincingly, and then weakens. A double bottom forms when price revisits a low, finds demand again, and refuses to continue lower. These structures become more meaningful when the neckline or reaction zone is clear and when the broader context supports a reversal rather than a random pause.
- Double tops usually reflect failure near resistance.
- Double bottoms usually reflect defense near support.
- Neckline levels often define confirmation.
- Repeated reactions improve structural clarity.
- Context helps separate real reversals from noisy stalls.
Breakouts need confirmation
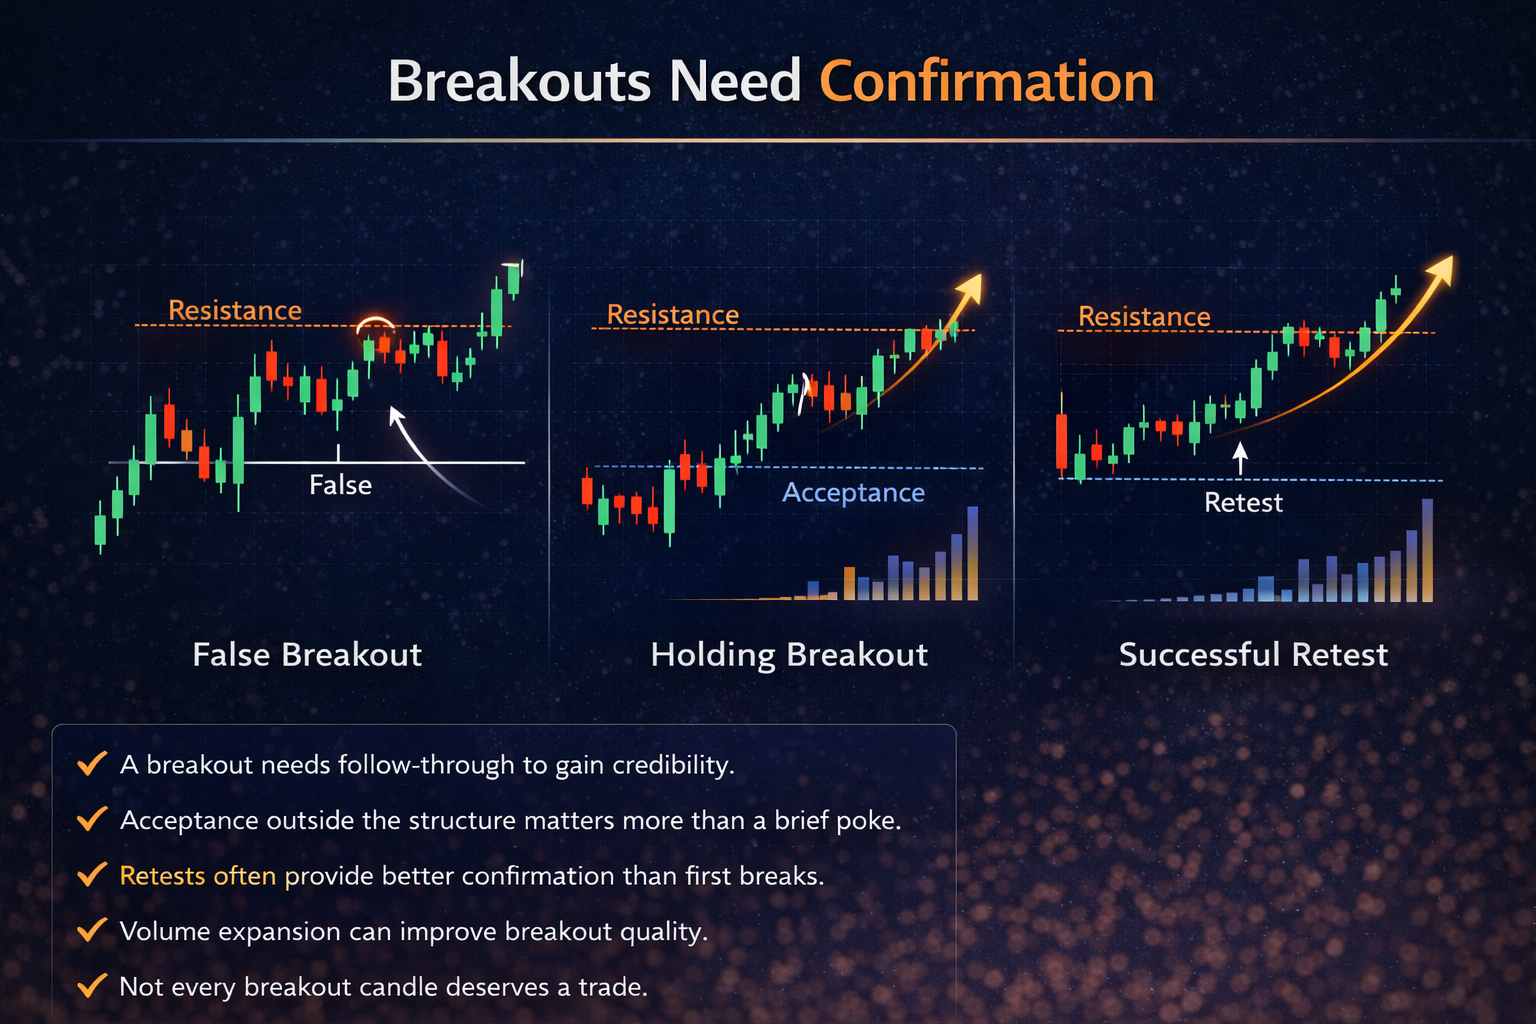
A pattern breakout is not meaningful just because price briefly trades beyond a boundary. What matters is whether price is accepted outside the structure. A breakout that holds, follows through, or successfully retests the level is more credible than a breakout that immediately snaps back. Many bad trades happen because traders react to the first move rather than waiting for confirmation. Confirmation can come from follow-through, retest behavior, momentum, or stronger participation around the break.
- A breakout needs follow-through to gain credibility.
- Acceptance outside the structure matters more than a brief poke.
- Retests often provide better confirmation than first breaks.
- Volume expansion can improve breakout quality.
- Not every breakout candle deserves a trade.
False breakouts and traps
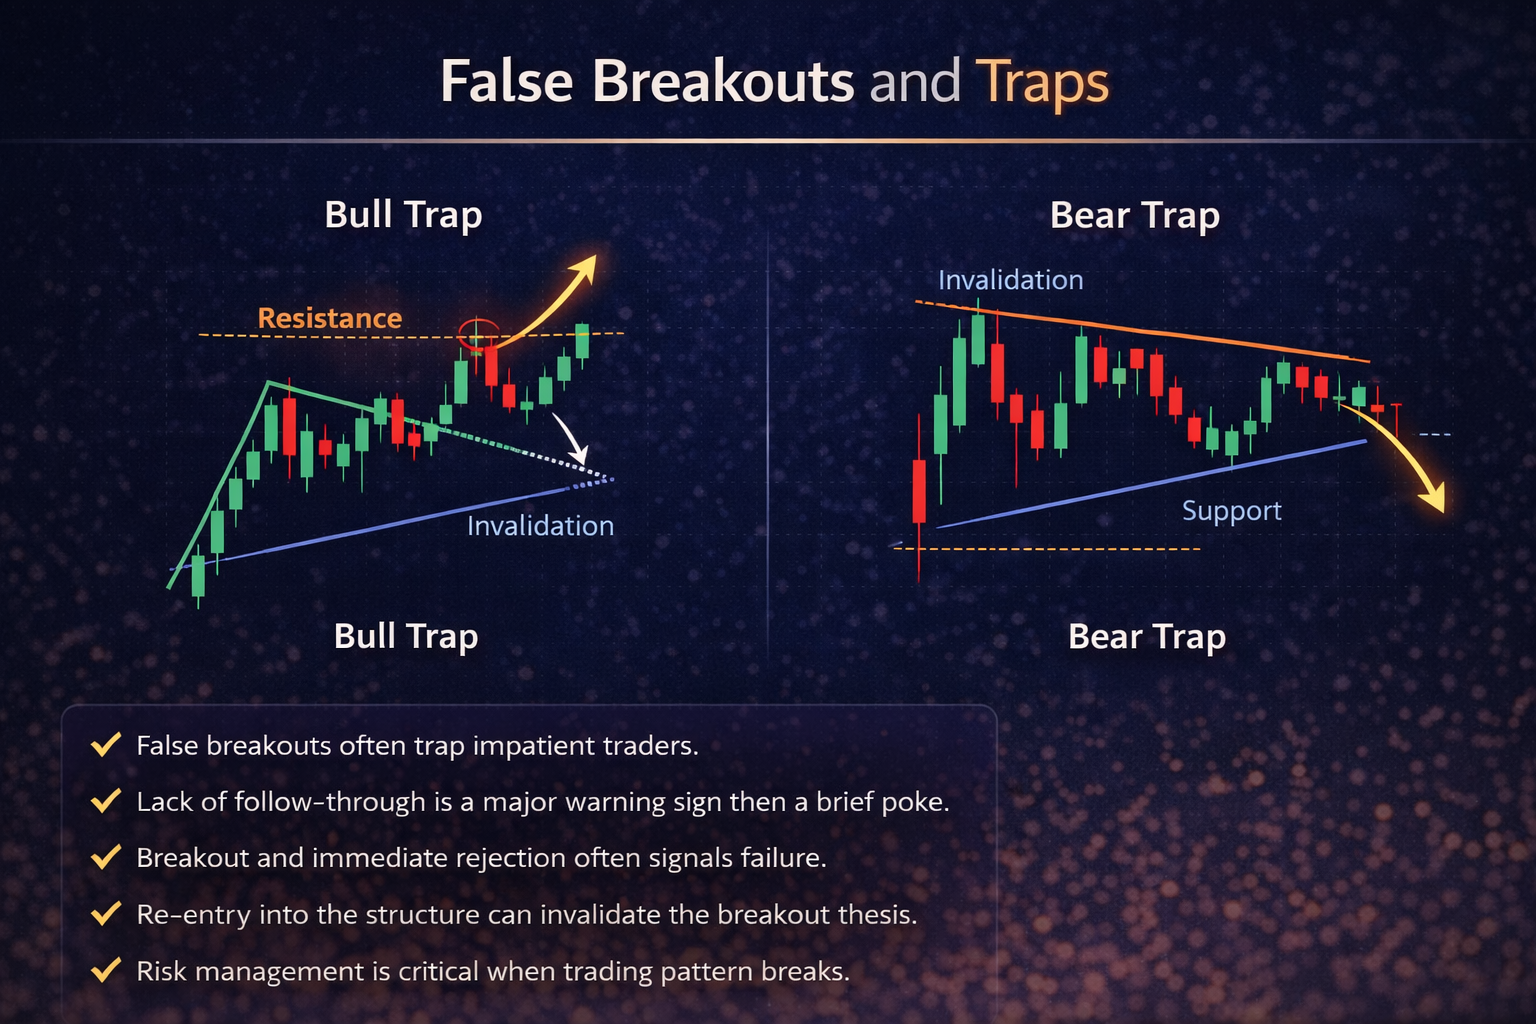
False breakouts happen when price briefly leaves the pattern and then quickly returns inside it. These moves often trap traders who entered too early without confirmation. Pattern traps are common around obvious levels because many participants are watching the same boundary. When price rejects the break and snaps back into the structure, it often signals that the move lacked true acceptance. This is why breakout traders need clear invalidation and why patient traders often wait for post-break behavior before committing.
- False breakouts often trap impatient traders.
- Lack of follow-through is a major warning sign.
- Breakout and immediate rejection often signals failure.
- Re-entry into the structure can invalidate the breakout thesis.
- Risk management is critical when trading pattern breaks.
How WOI Scanner uses pattern logic
The WOI Scanner evaluates chart patterns through structure, not through visual guesswork alone. Rectangles, triangles, double tops and double bottoms are assessed using swing behavior, compression quality, repeated tests and breakout attempts. The goal is not to label every chart with a pattern name. The goal is to identify structures that are technically meaningful and worth deeper analysis. This helps traders focus on charts where price behavior is clearer and where potential invalidation is more logical.
- The scanner detects rectangles and compression patterns structurally.
- Double top and double bottom logic is based on swing behavior.
- Breakout attempts and retest behavior add context.
- Structure quality affects whether a pattern is worth highlighting.
- The objective is better chart selection, not automatic prediction.
Checklist
Before trading a chart pattern, it helps to slow down and confirm that the structure is real, the context supports the idea, and the risk is defined. This prevents traders from forcing patterns onto random noise and helps them focus on meaningful setups instead.
- Is the pattern clearly visible, or am I forcing it?
- Are the boundaries clean and tested more than once?
- Does the broader trend support the idea or conflict with it?
- What confirms the pattern and what invalidates it?
- Has the breakout shown real acceptance or only a brief move?
- Is the risk-to-reward attractive enough to justify the trade?
Apply this in WOI
Open the scanner, pick one symbol, and practice:
mark zones, decide trend regime, and write one invalidation level.
The goal is a repeatable process, not perfect predictions.
Disclaimer: Educational content only. Not financial advice.