WOI Guides
Moving Averages — Trend, Structure and Context
How moving averages help define trend regime, dynamic support and resistance, and chart context without being used as blind signals.
In this guide
What moving averages actually do
Moving averages smooth price data so traders can see the broader direction and structure more clearly. Instead of reacting to every small fluctuation, moving averages help traders focus on trend direction, structure quality and price location relative to its recent history. Their main purpose is not to generate automatic buy or sell signals, but to provide context about trend and market structure.
- Moving averages smooth price action.
- They help identify trend direction.
- They provide structure context.
- They are better as context tools than signal generators.
- Price location relative to averages matters.
Why traders use them
Traders use moving averages because they simplify charts and help answer important questions: Is the market trending? Is price extended? Is the pullback shallow or deep? Many traders also watch similar moving averages, which can create reactions around these levels as more participants make decisions based on the same reference points.
- Moving averages help identify trend direction.
- They help measure whether price is extended.
- They help identify pullback areas.
- Many traders watch the same averages.
- They help simplify chart structure.
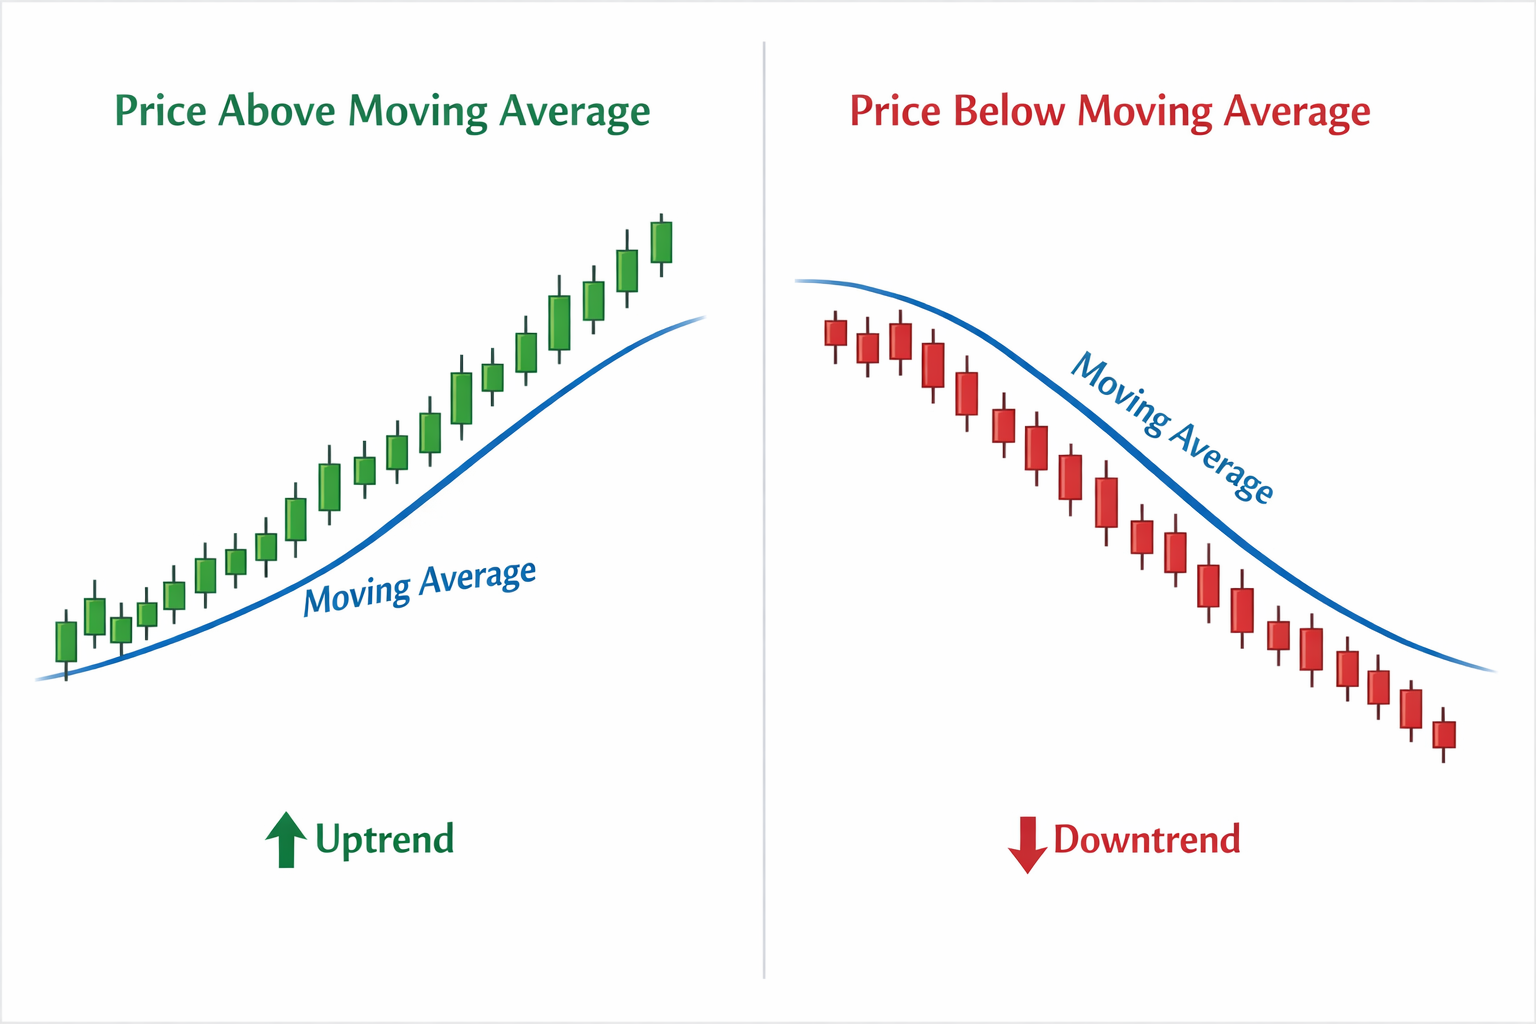
Dynamic support and resistance
Moving averages can sometimes act as dynamic support or resistance. In strong trends, price often pulls back toward a rising moving average and then continues in the direction of the trend. In downtrends, rallies may fail near falling moving averages. However, moving averages should not be treated as exact levels but as zones where reactions may occur.
- Moving averages can act as dynamic support.
- Falling averages can act as dynamic resistance.
- They are zones, not exact price levels.
- Strong trends often respect rising averages.
- Weak trends often break through averages easily.
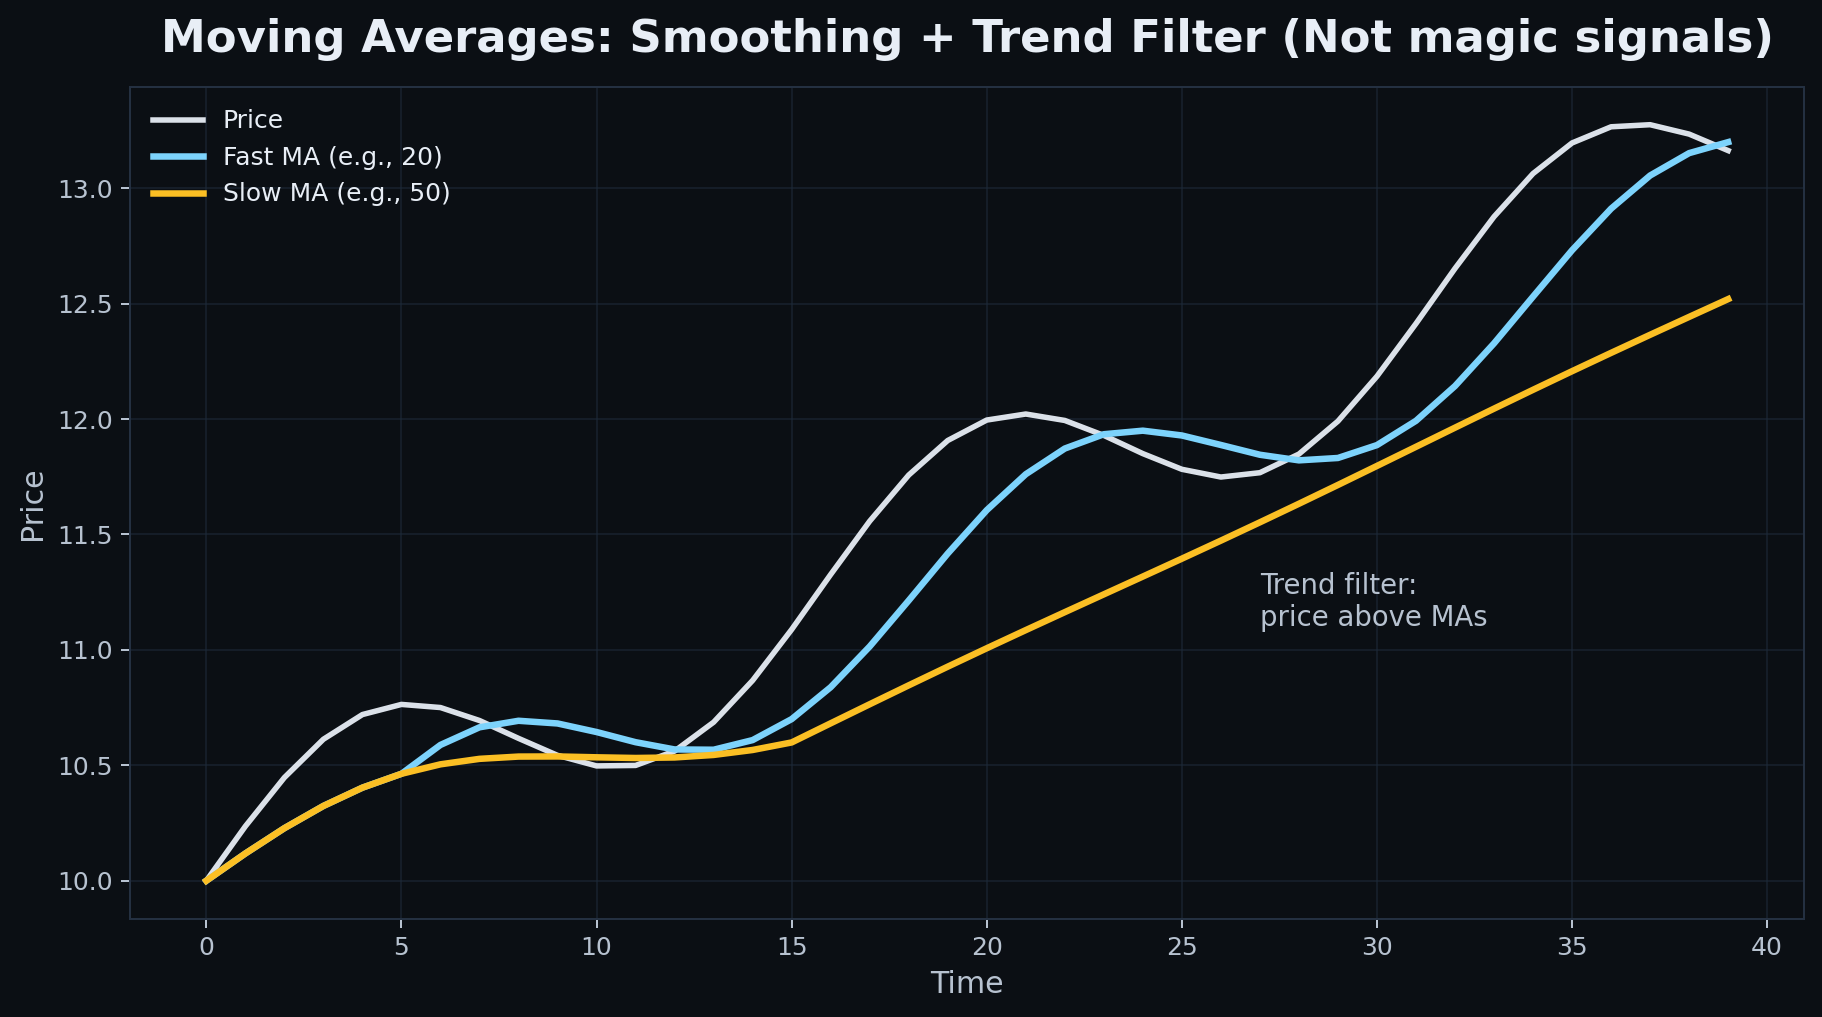
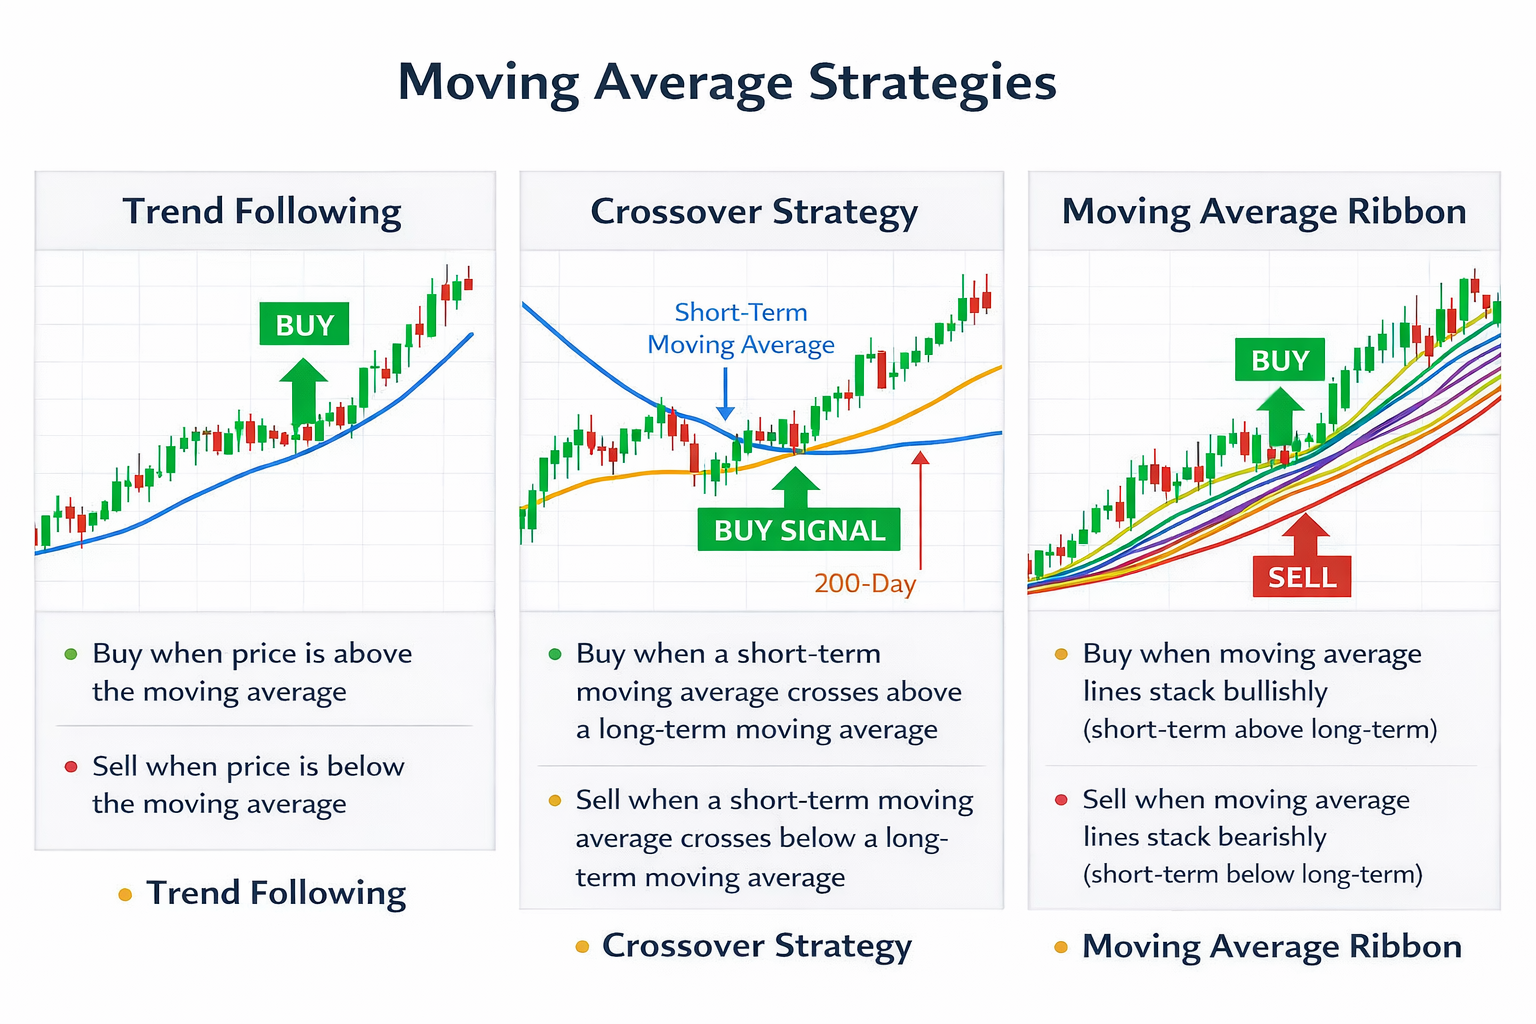
Trend filter vs entry trigger
One of the most useful ways to use moving averages is as a trend filter rather than an entry signal. Traders often look for long trades when price is above rising averages and short trades when price is below falling averages. This helps align trades with the broader trend rather than fighting it.
- Moving averages work well as trend filters.
- They are less reliable as entry triggers alone.
- Trading with the trend usually improves probability.
- Trend filters reduce counter-trend trades.
- Moving averages help define directional bias.
Short-term vs long-term averages
Different moving averages represent different time horizons. Short-term averages react quickly to price and reflect momentum and short-term structure. Long-term averages move more slowly and represent the broader trend. Understanding the difference helps traders avoid reacting too quickly or too slowly.
- Short-term averages react quickly to price.
- Long-term averages define broader trend direction.
- Multiple averages can show trend alignment.
- When averages align, trend structure is often strong.
- When averages flatten, the market may be ranging.
EMA vs SMA
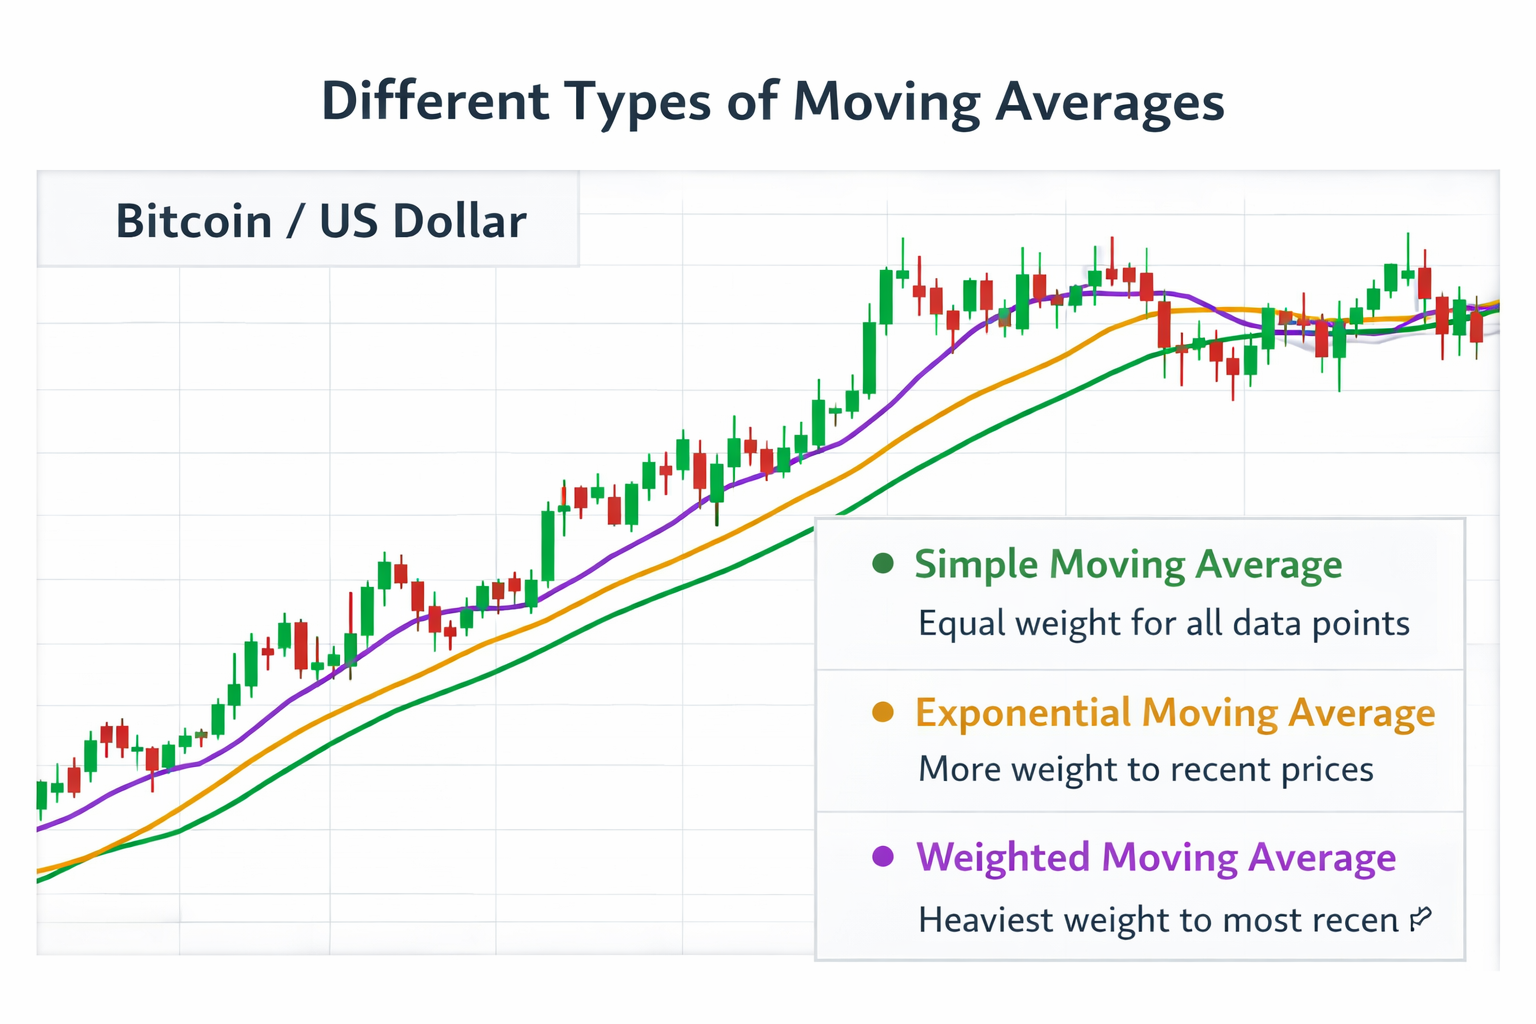
Exponential moving averages react faster to recent price changes, while simple moving averages move more slowly and smoothly. Neither is always better; they simply react differently. Many traders prefer exponential averages for shorter timeframes and simple averages for longer-term trend reference.
- EMA reacts faster to recent price changes.
- SMA moves more slowly and smoothly.
- EMA is often used for short-term trend.
- SMA is often used for long-term trend.
- The difference is responsiveness, not accuracy.
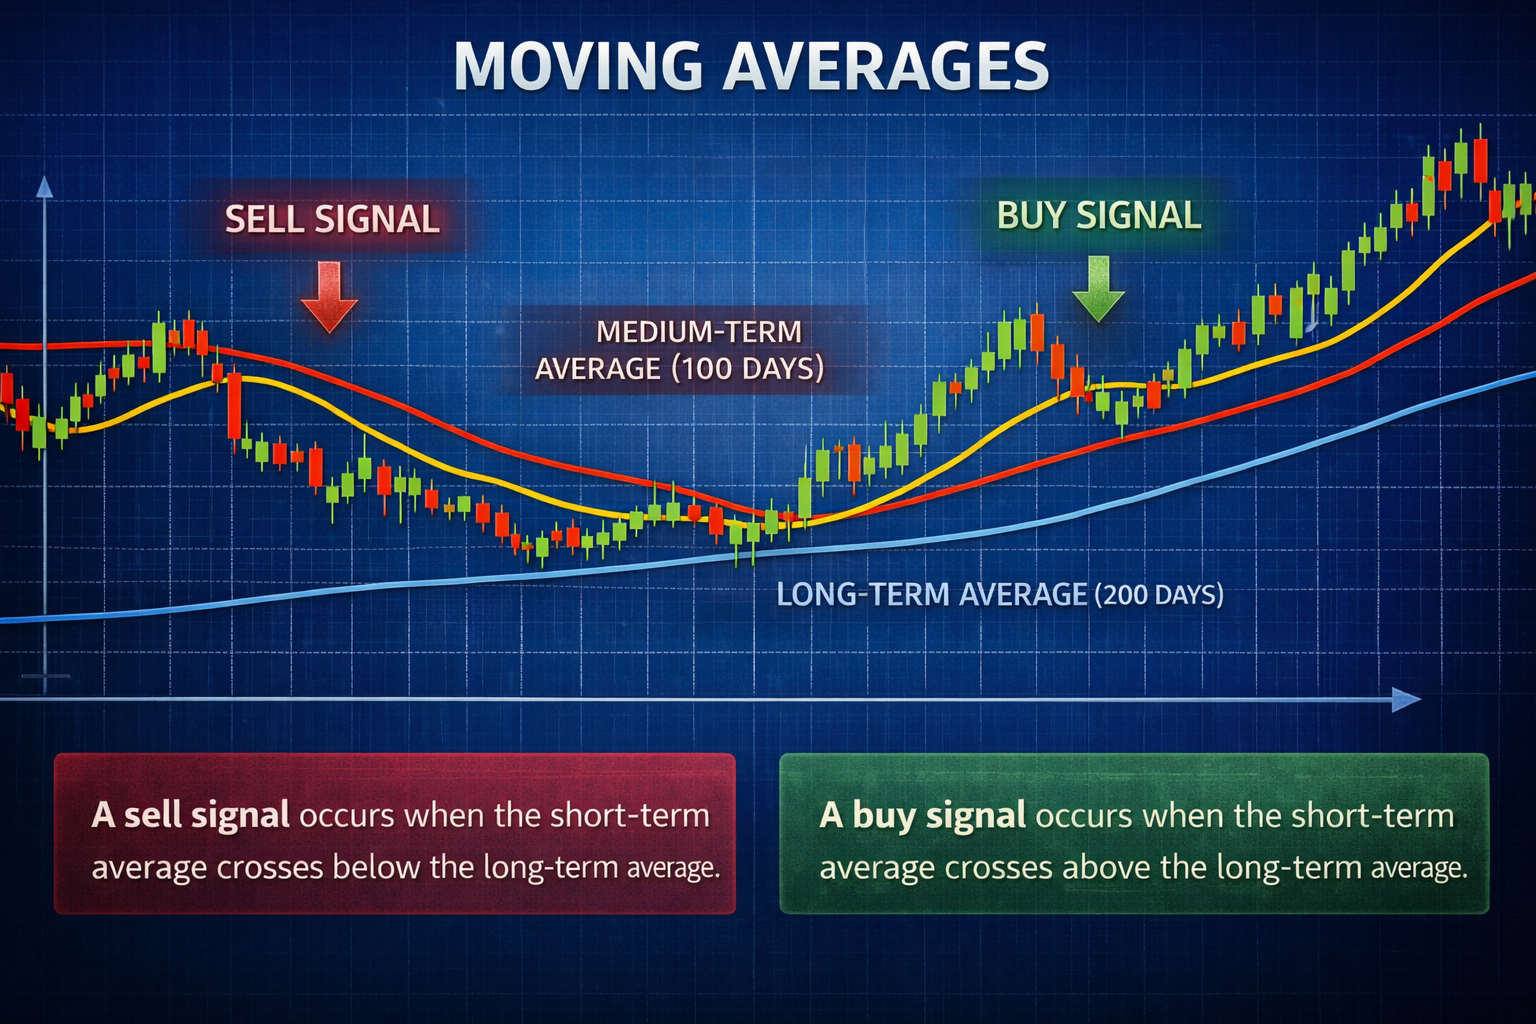
Crossovers: useful or overrated?
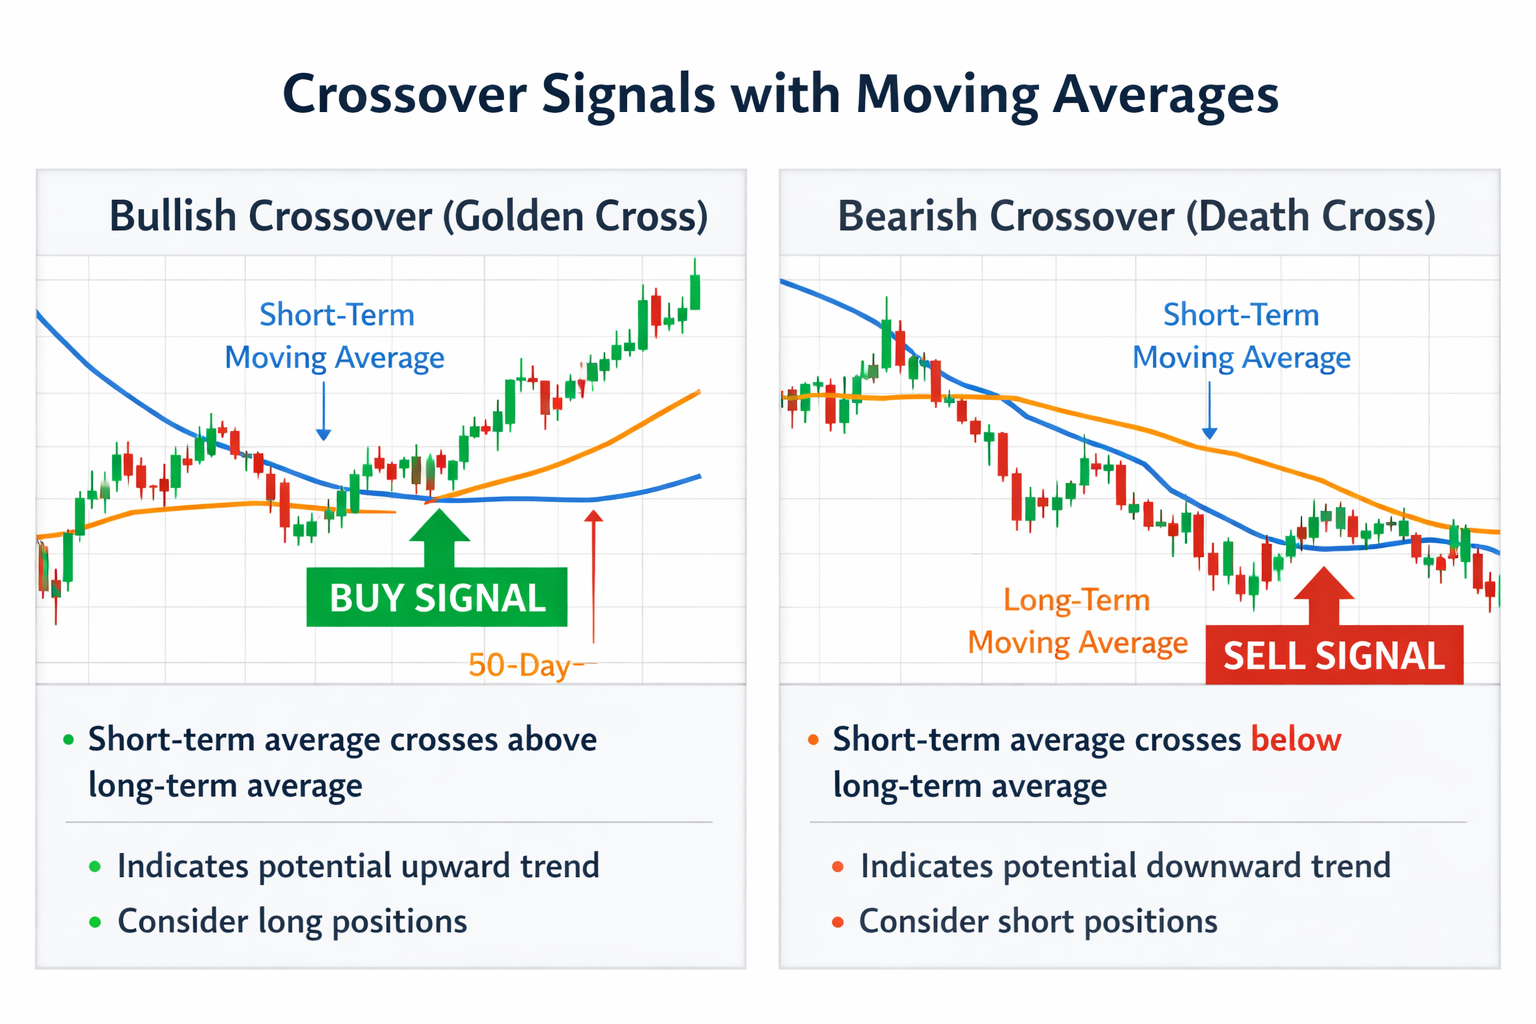
Moving average crossovers are popular but often misunderstood. Crossovers usually happen after a move has already started, which means they lag price. They can be useful for confirming trend shifts but should not be used alone as a trading signal without structure, levels and risk planning.
- Crossovers are lagging signals.
- They confirm trends more than predict them.
- Crossovers work better in trending markets.
- They often fail in ranging markets.
- Structure and levels should come first.
Common mistakes
Many traders misuse moving averages by treating them as automatic signals. Moving averages are tools for context, not trading systems by themselves. The most common mistakes happen when traders ignore structure, support and resistance, and risk management.
- Buying every moving average crossover.
- Ignoring support and resistance levels.
- Entering when price is extended from averages.
- Using too many moving averages.
- Trading without considering market regime.
How WOI Scanner uses moving averages
The WOI Scanner uses moving averages mainly to evaluate trend structure and market context. EMA alignment, distance from averages, and trend direction all help determine technical quality. Moving averages are not used as direct signals, but as part of the broader structure and trend evaluation.
- EMA alignment helps define trend structure.
- Distance from averages helps identify extension.
- Moving averages help evaluate trend quality.
- They are used as context tools in the scanner.
- They help rank stocks by technical structure.
Checklist
Before using moving averages in a trade idea, traders should confirm that the averages are being used for context rather than as automatic signals. This checklist helps avoid common mistakes.
- Is the moving average rising, falling or flat?
- Is price above or below the average?
- Is price extended from the average?
- Is the market trending or ranging?
- Are support and resistance levels nearby?
- Does the trade make sense beyond the moving average?
Apply this in WOI
Open the scanner, pick one symbol, and practice:
mark zones, decide trend regime, and write one invalidation level.
The goal is a repeatable process, not perfect predictions.
Disclaimer: Educational content only. Not financial advice.