WOI Guides
RSI Explained — Momentum, Context and Range Shifts
How traders use RSI to read momentum, trend ranges and divergence without treating overbought and oversold labels as automatic signals.
In this guide
What RSI actually measures
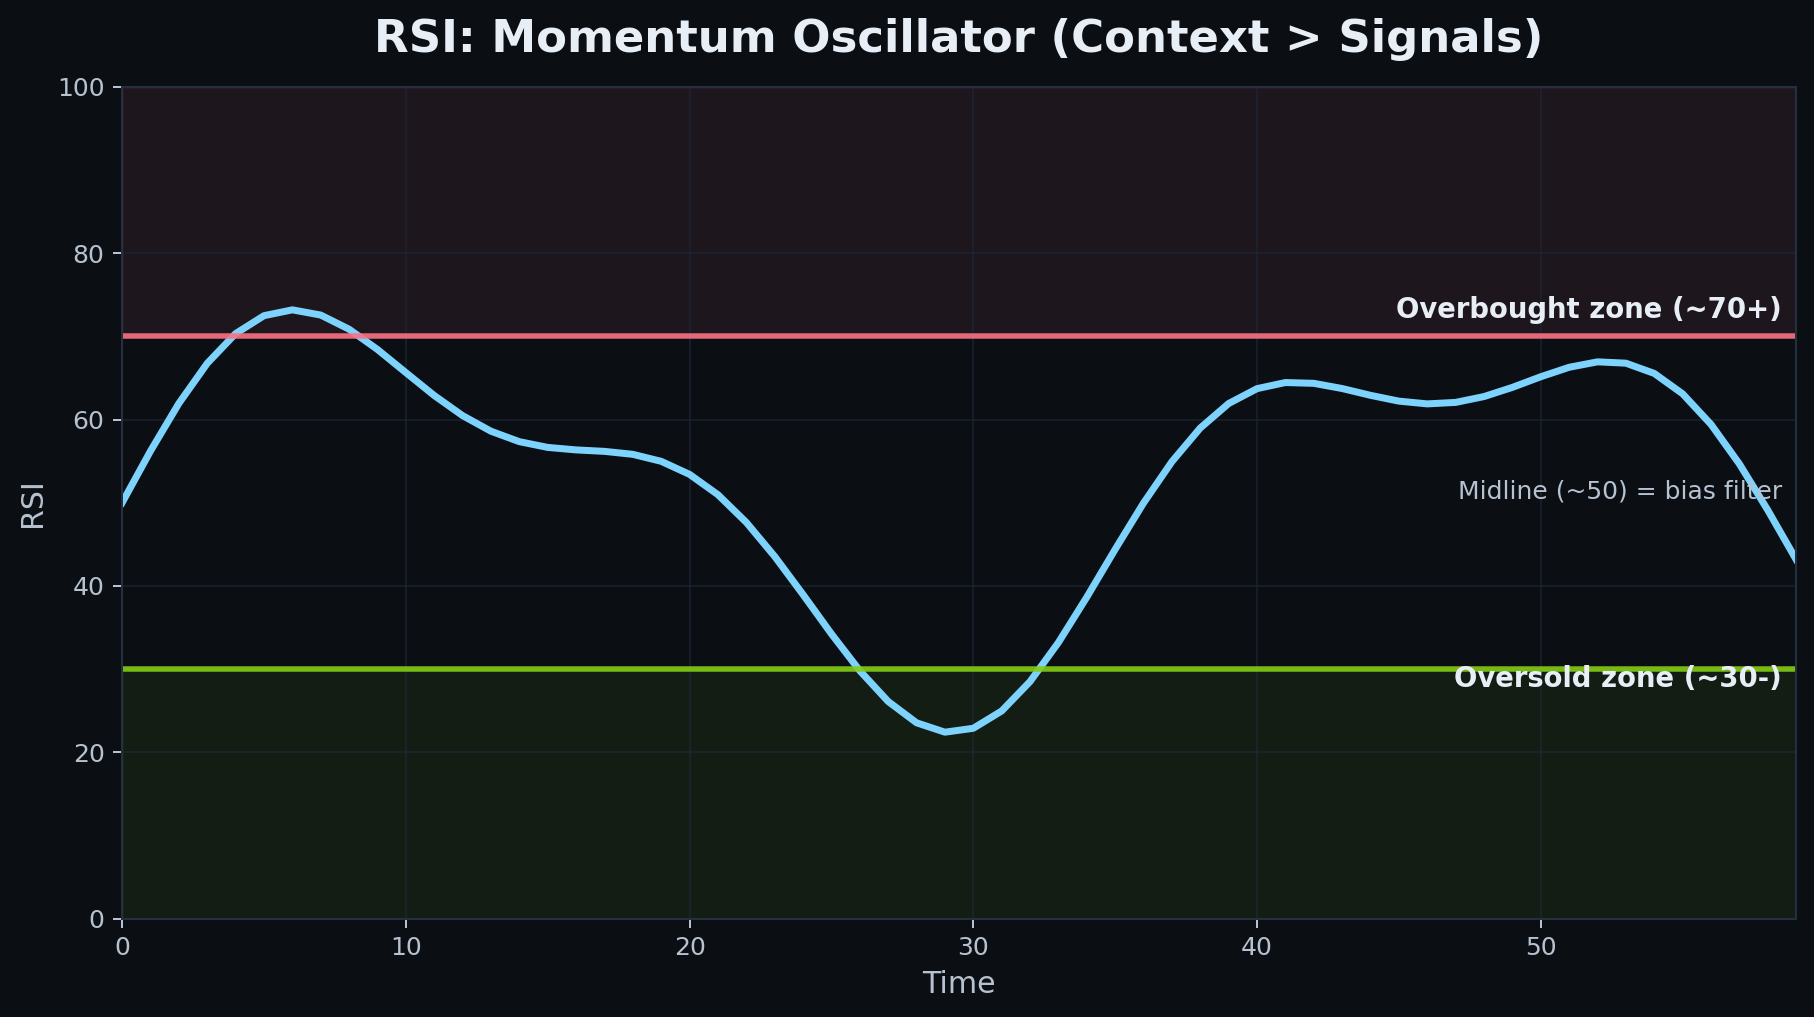
RSI is a momentum oscillator. It compares the speed and relative strength of recent gains against recent losses and expresses that relationship on a bounded scale. What RSI does not do is tell traders whether price is objectively cheap or expensive. It is not a valuation tool and it is not a prediction machine. Its real value is helping traders understand how strongly price has been moving, whether momentum is improving or weakening, and how that momentum behaves relative to the current chart structure.
- RSI measures momentum, not value.
- It compares recent gains and losses in relative terms.
- A high RSI does not automatically mean price must fall.
- A low RSI does not automatically mean price must rise.
- RSI is most useful when read together with structure and trend.
Why overbought and oversold are misunderstood
One of the biggest RSI mistakes is assuming that overbought always means sell and oversold always means buy. In reality, strong trends can keep RSI elevated or depressed for much longer than beginners expect. In a healthy uptrend, RSI may stay strong while price continues climbing because persistent buying pressure remains in control. In a strong downtrend, RSI can stay weak as selling pressure continues. This is why fixed labels such as overbought and oversold should be interpreted with caution. Context matters more than the label.
- Overbought does not automatically mean reversal.
- Oversold does not automatically mean rebound.
- Strong trends can keep RSI extreme for longer than expected.
- RSI labels should be read in context, not in isolation.
- Momentum persistence is normal in trending markets.
RSI behavior in different regimes
RSI behaves differently depending on whether the market is trending or ranging. In bullish trends, RSI often finds support in higher zones during pullbacks and pushes into stronger territory during continuation moves. In bearish trends, RSI often fails in lower zones during rebounds and spends more time weak. In range-bound markets, RSI tends to oscillate more traditionally from stronger to weaker readings because price itself is rotating rather than trending. Learning to recognize these regime shifts makes RSI much more useful.
- RSI often behaves differently in trends than in ranges.
- Bullish trends usually keep RSI in stronger zones.
- Bearish trends usually keep RSI in weaker zones.
- Range markets often produce cleaner oscillation behavior.
- Regime awareness improves RSI interpretation.
RSI range shifts
One of the most practical RSI concepts is the idea of range shifts. In strong uptrends, RSI may repeatedly pull back only into higher ranges before turning up again. In downtrends, RSI may rally only into lower ranges before rolling over. These shifts can help traders identify whether momentum is supporting the dominant trend or beginning to change character. A market that starts holding higher RSI lows may be improving internally even before price structure becomes obvious. Likewise, a weakening RSI range can warn that a trend is losing quality.
- Range shifts help reveal underlying trend character.
- Bullish range behavior often keeps RSI elevated on pullbacks.
- Bearish range behavior often caps RSI during rebounds.
- Improving RSI structure can hint at momentum recovery.
- Weakening RSI ranges can warn of trend deterioration.
Divergence
Divergence is one of the most discussed RSI concepts, but it is also one of the most misunderstood. Bullish divergence happens when price makes a lower low while RSI makes a higher low, suggesting downside momentum may be weakening. Bearish divergence happens when price makes a higher high while RSI makes a lower high, suggesting upside momentum may be weakening. Divergence does not guarantee reversal. It is better viewed as a warning that momentum and price are no longer fully aligned. The best divergences usually appear near meaningful support, resistance or exhaustion areas.
- Bullish divergence can signal weakening downside momentum.
- Bearish divergence can signal weakening upside momentum.
- Divergence is a warning, not a trade setup by itself.
- The location of the divergence matters a lot.
- Structure and confirmation still come first.
RSI as a confirmation tool
RSI is often strongest when used as a confirmation tool rather than as a stand-alone trigger. Traders may use RSI to confirm that a breakout has momentum, that a pullback is occurring within a healthy trend range, or that a suspected reversal is supported by improving internal strength. This does not mean RSI must agree perfectly with every trade idea. It means RSI can help traders judge whether momentum behavior supports or conflicts with the structure they see on the chart.
- RSI often works best as confirmation rather than prediction.
- It can support breakout, pullback and reversal analysis.
- Momentum agreement can strengthen a structural thesis.
- Momentum conflict can warn that a setup is weaker than it looks.
- RSI should complement structure, not replace it.
Common mistakes
Most RSI mistakes come from treating it as a shortcut. Traders often buy oversold readings in strong downtrends, sell overbought readings in strong uptrends, or take divergence signals without any structural confirmation. Others ignore market regime completely and expect RSI to behave the same way in all conditions. RSI becomes much more useful once traders stop demanding a simple buy-or-sell label from it and start using it as a context and momentum tool instead.
- Buying oversold blindly in strong downtrends.
- Selling overbought blindly in strong uptrends.
- Taking divergence without structure confirmation.
- Ignoring trend regime and context.
- Treating RSI as a stand-alone trading system.
How WOI Scanner uses RSI context
The WOI Scanner treats RSI as part of broader technical context rather than as an isolated trigger. RSI behavior can help enrich the technical narrative by showing whether momentum is aligned with trend structure, whether a move is stretched, and whether a chart is behaving more like a trend or a range. The purpose is not to reduce the chart to one oscillator reading. The purpose is to combine RSI with structure, levels and momentum behavior to create a more grounded interpretation.
- RSI helps enrich momentum context in the scanner.
- It supports narrative quality rather than replacing structure.
- RSI can help identify trend or range behavior.
- Momentum alignment improves interpretation.
- The scanner uses RSI as one piece of the overall chart story.
Checklist
Before using RSI in a trade idea, it helps to slow down and ask whether momentum is actually supporting the chart structure or whether you are only reacting to a number. That small pause often prevents weak trades based on simplistic overbought or oversold assumptions.
- What market regime is the chart in?
- Is RSI behaving like a trend oscillator or a range oscillator?
- Is RSI confirming the current structure or diverging from it?
- Is the reading happening near meaningful support or resistance?
- What confirms the idea beyond RSI itself?
- Does the setup still make sense without forcing the oscillator?
Apply this in WOI
Open the scanner, pick one symbol, and practice:
mark zones, decide trend regime, and write one invalidation level.
The goal is a repeatable process, not perfect predictions.
Disclaimer: Educational content only. Not financial advice.