WOI Guides
Downtrend Breakouts — Structure Shift and Acceptance
How traders evaluate breaks of falling structures and distinguish early structural shifts from late and weak breakouts.
In this guide
What a downtrend breakout actually is · Why breaking a line is not enough · Break of structure vs break of line · Fresh breakout vs late breakout · Acceptance above the trendline · Retest and reclaim behavior · False downtrend breaks · Volume and momentum confirmation · How WOI Scanner detects downtrend breaks · Checklist
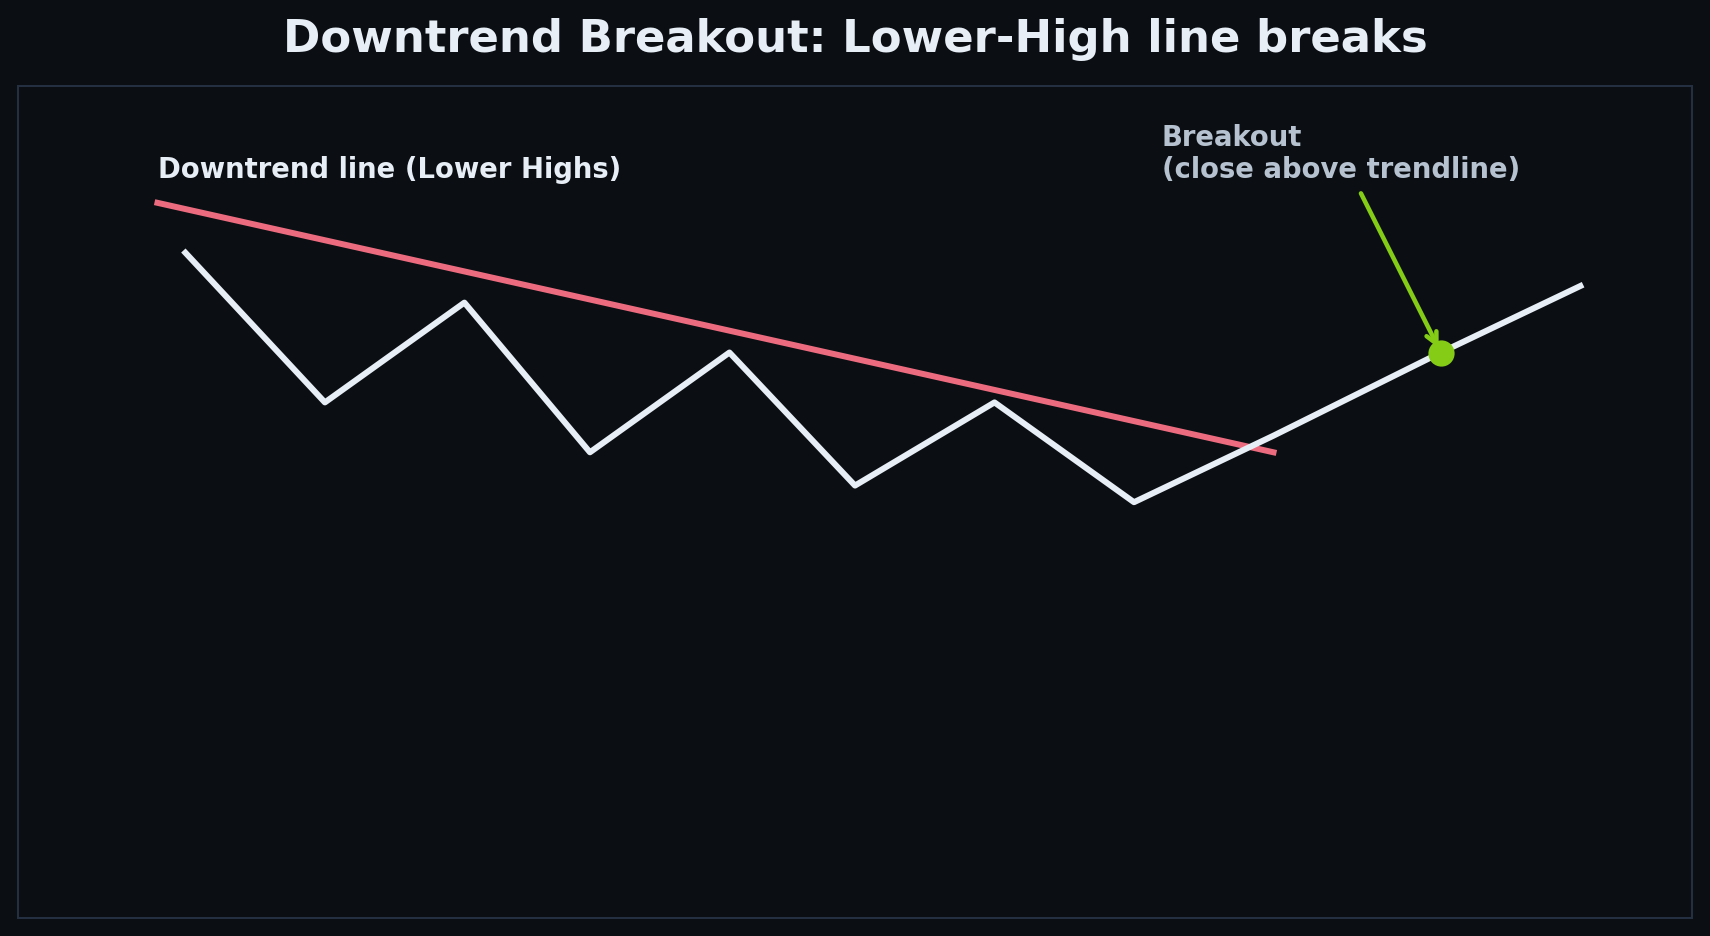
What a downtrend breakout actually is
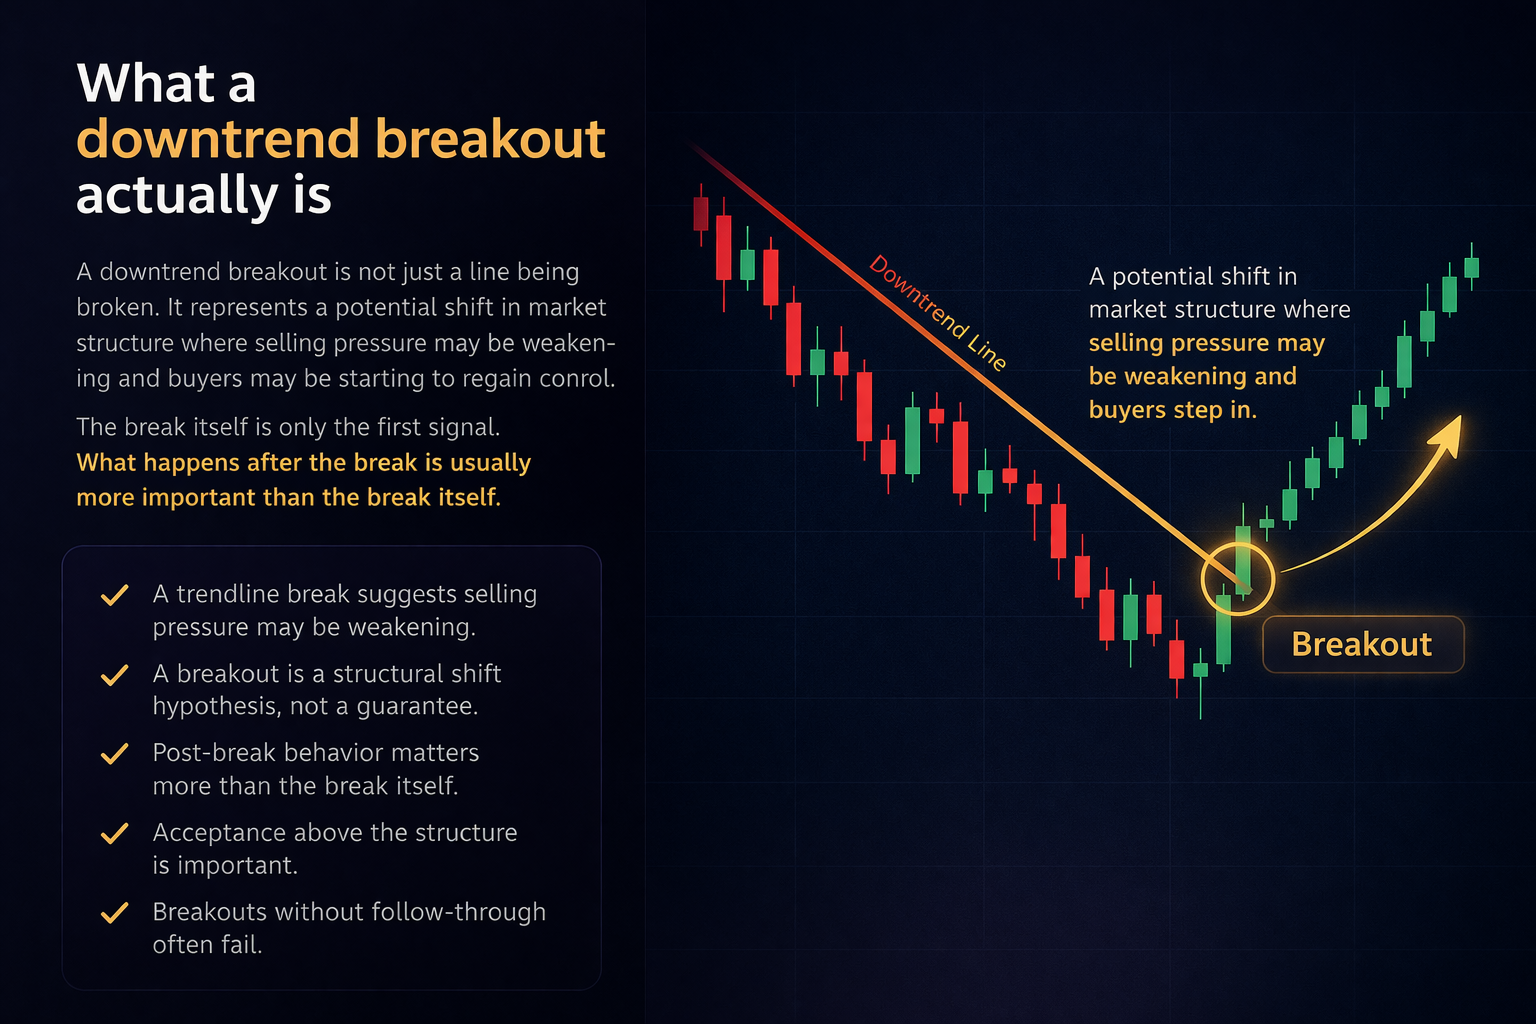
A downtrend breakout is not just a line being broken. It represents a potential shift in market structure where selling pressure may be weakening and buyers may be starting to regain control. The break itself is only the first signal. What happens after the break is usually more important than the break itself.
- A trendline break suggests selling pressure may be weakening.
- A breakout is a structural shift hypothesis, not a guarantee.
- Post-break behavior matters more than the break itself.
- Acceptance above the structure is important.
- Breakouts without follow-through often fail.
Why breaking a line is not enough
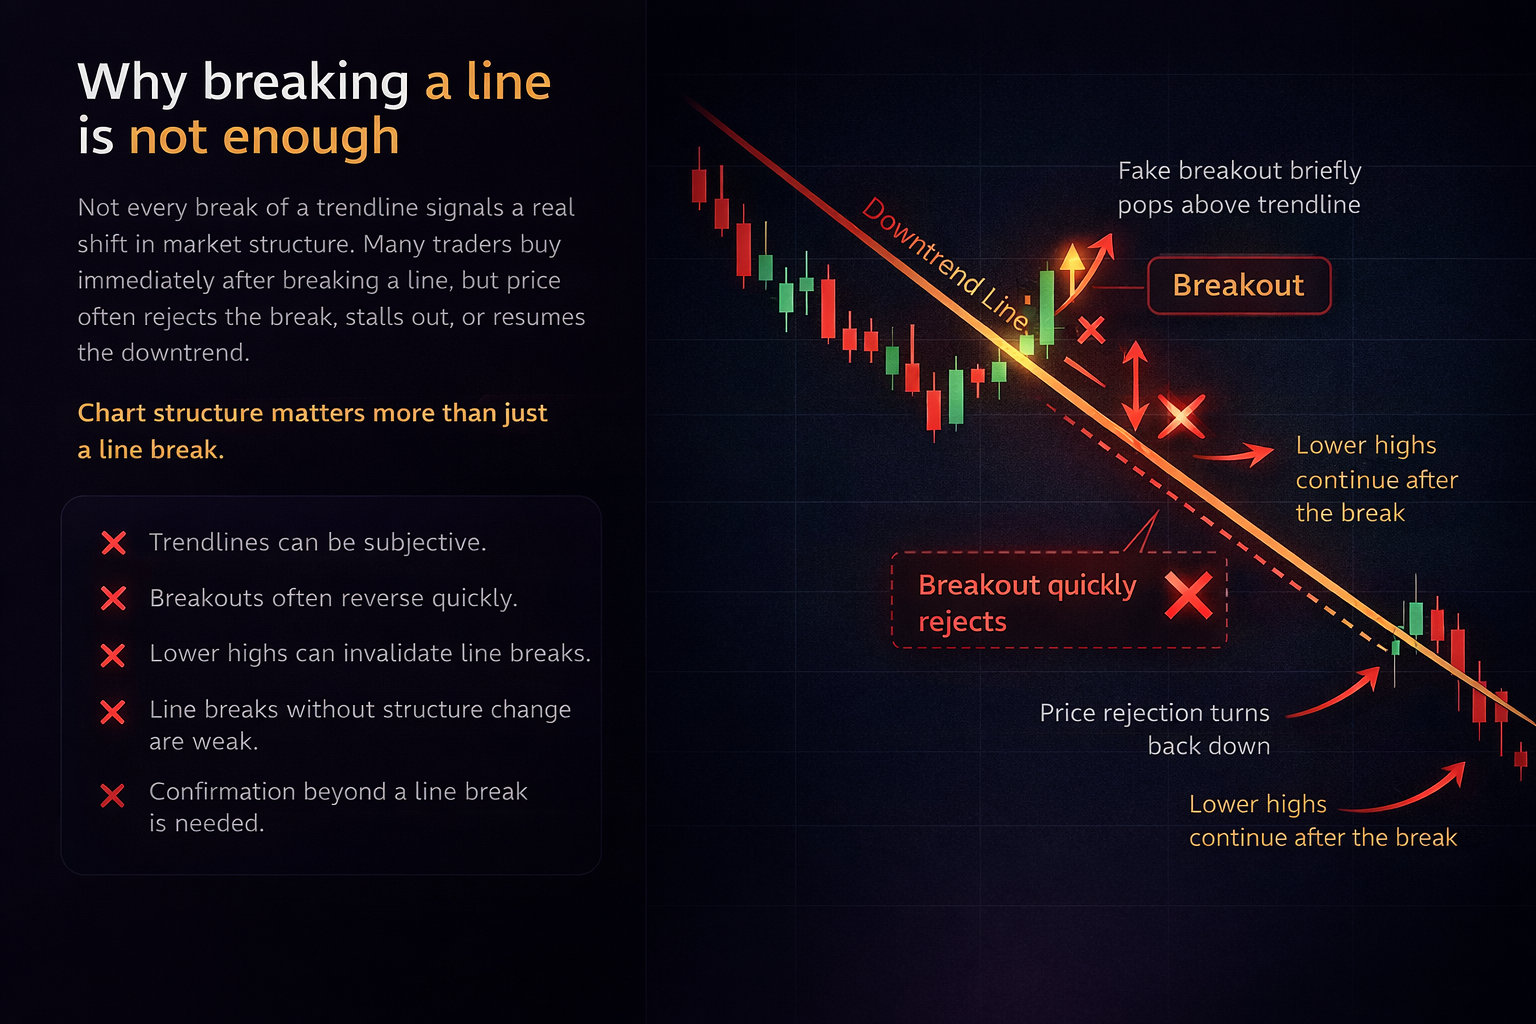
Many traders make the mistake of treating a trendline break as an automatic buy signal. But trendlines can be subjective, and price often breaks lines briefly before continuing lower. A real structural shift usually involves more than just one line break. Traders should look for changes in swing structure, momentum, and behavior after the break.
- Trendlines can be subjective.
- Price often briefly breaks lines and reverses.
- Structure change matters more than line breaks.
- Follow-through helps confirm breakouts.
- Retests often provide better confirmation than first breaks.
Break of structure vs break of line
A break of structure is often more meaningful than a simple trendline break. If price starts making higher lows and higher highs after breaking the downtrend structure, this suggests a real shift in control. If price only breaks a line but continues making lower highs, the downtrend may still be intact.
- Break of structure is stronger than break of line.
- Higher lows after the break are important.
- Lower highs after a break can weaken the setup.
- Structure change signals trend shift.
- Line breaks without structure change are weaker signals.
Fresh breakout vs late breakout
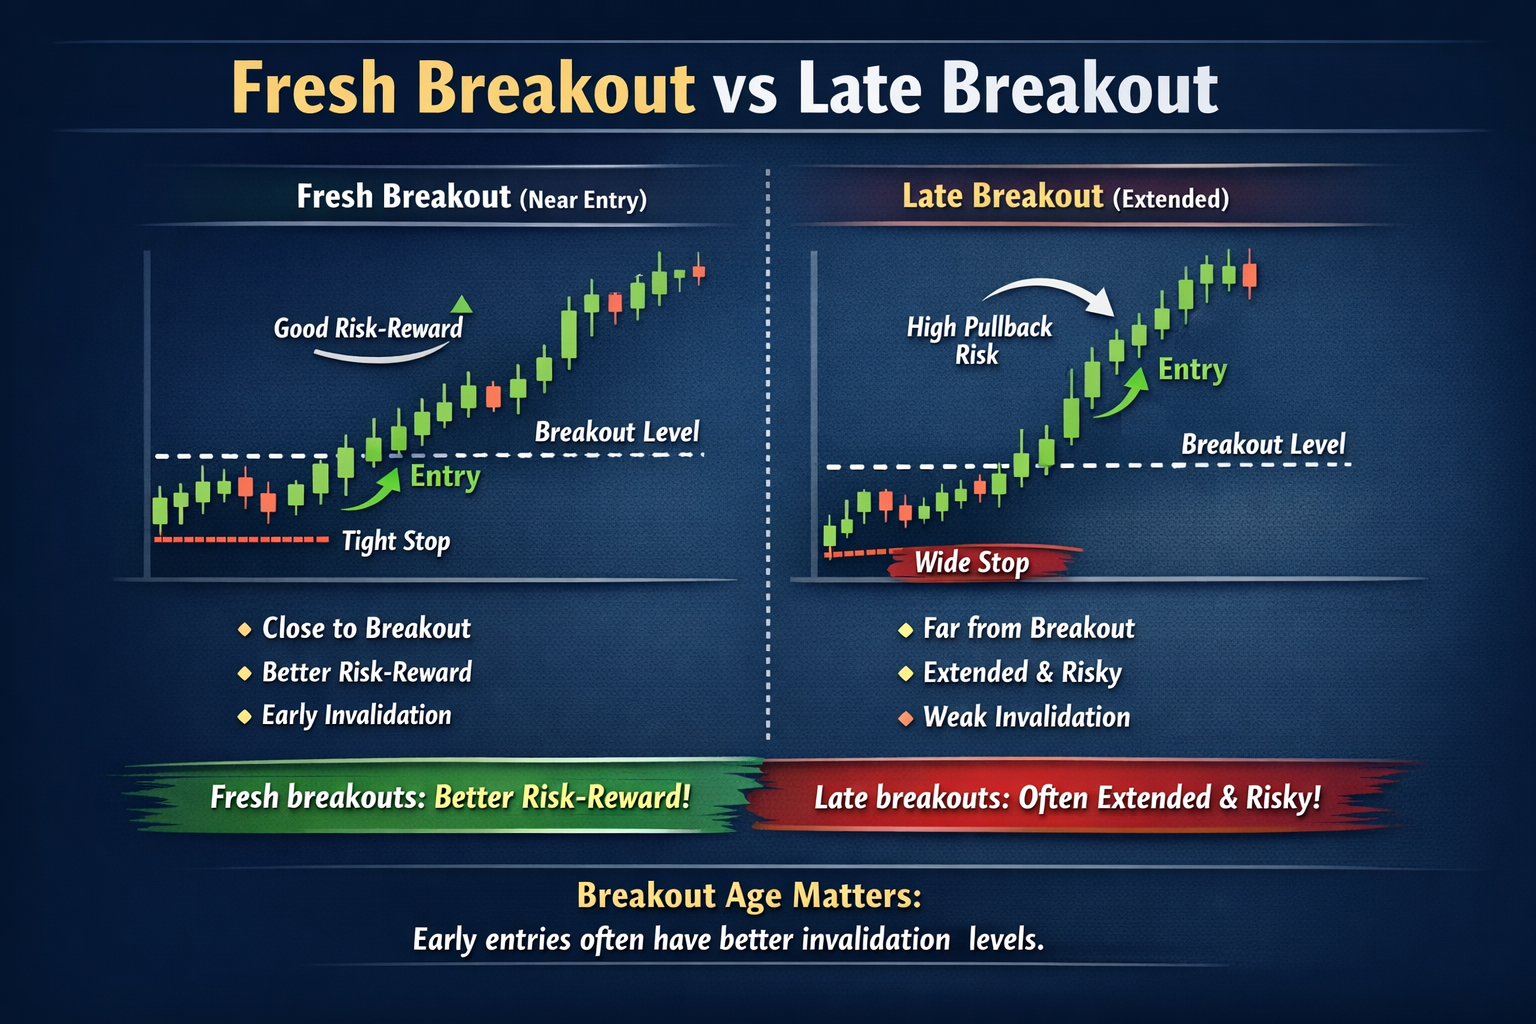
Fresh breakouts occur close to the structural shift point and often offer better risk-reward opportunities. Late breakouts happen after price has already moved significantly away from the breakout level, which increases the risk of pullbacks or failed continuation. Evaluating how far price has moved after the breakout helps traders judge whether the setup is still early or already extended.
- Fresh breakouts usually offer better risk-reward.
- Late breakouts are often extended.
- Extended price increases pullback risk.
- Breakout age matters.
- Early entries often have better invalidation levels.
Acceptance above the trendline
Acceptance above a broken trendline is often more important than the initial break. If price stays above the reclaimed area and builds structure, the breakout becomes more credible. If price quickly falls back below the trendline, the breakout may have failed.
- Holding above the trendline shows acceptance.
- Quick rejection weakens breakout setups.
- Sideways consolidation above the line can be constructive.
- Reclaimed levels often become support.
- Acceptance matters more than the first breakout candle.
Retest and reclaim behavior
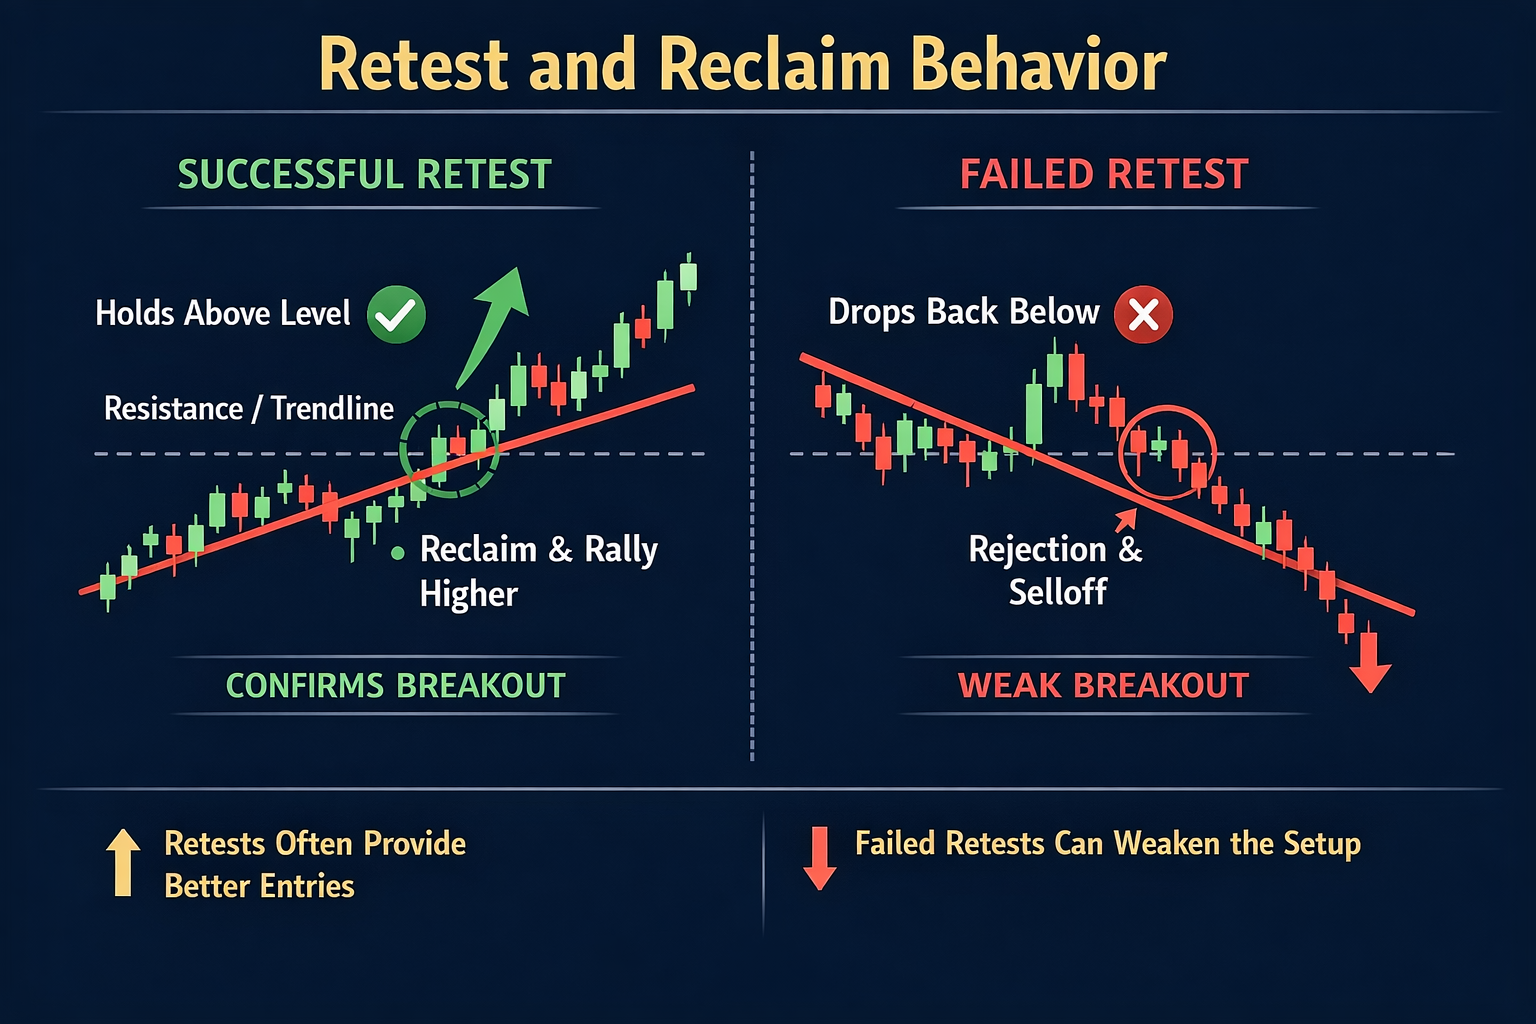
Many strong breakouts retest the broken trendline or nearby resistance before continuing higher. A successful retest that holds above the level can strengthen the breakout thesis. Failed retests, where price quickly drops back below the level, often signal weak breakouts.
- Retests are common after breakouts.
- Successful retests can confirm breakouts.
- Failed retests often weaken the setup.
- Reclaim behavior is important.
- Retests often provide better entries than initial breaks.
False downtrend breaks
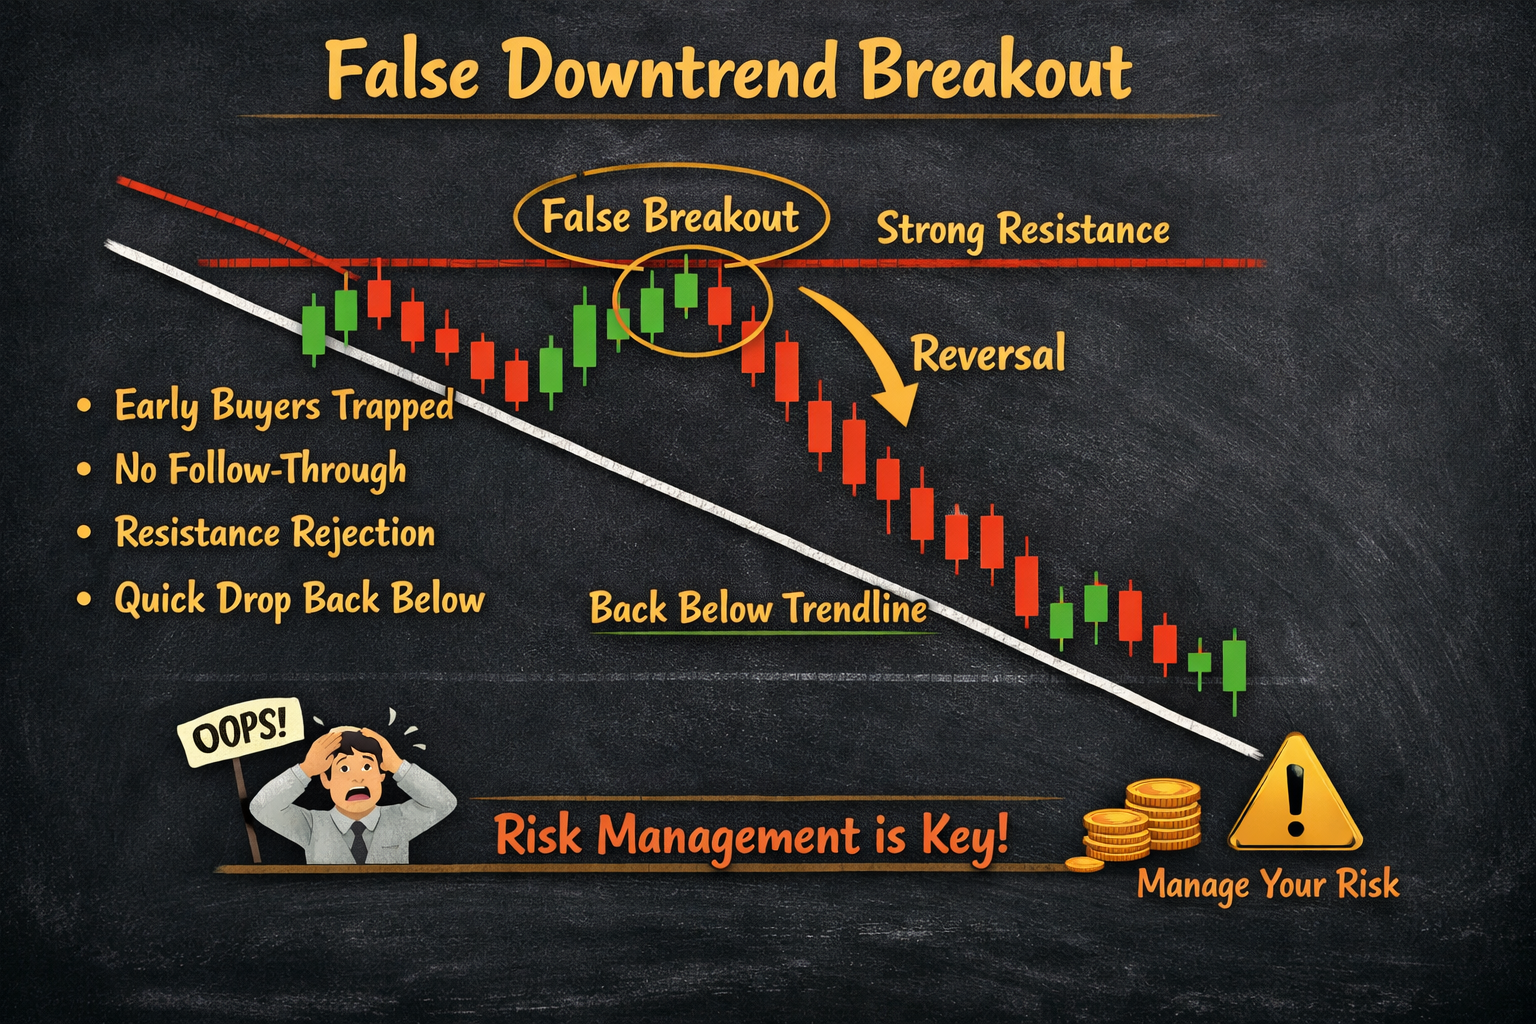
False breakouts occur when price briefly breaks above a downtrend line but quickly returns below it. These moves often trap traders who enter too early without confirmation. False breaks are especially common when there is strong resistance just above the trendline.
- False breakouts trap early buyers.
- Lack of follow-through is a warning sign.
- Resistance above the break can cause failures.
- Quick return below trendline weakens the setup.
- Risk management is critical for breakout trades.
Volume and momentum confirmation
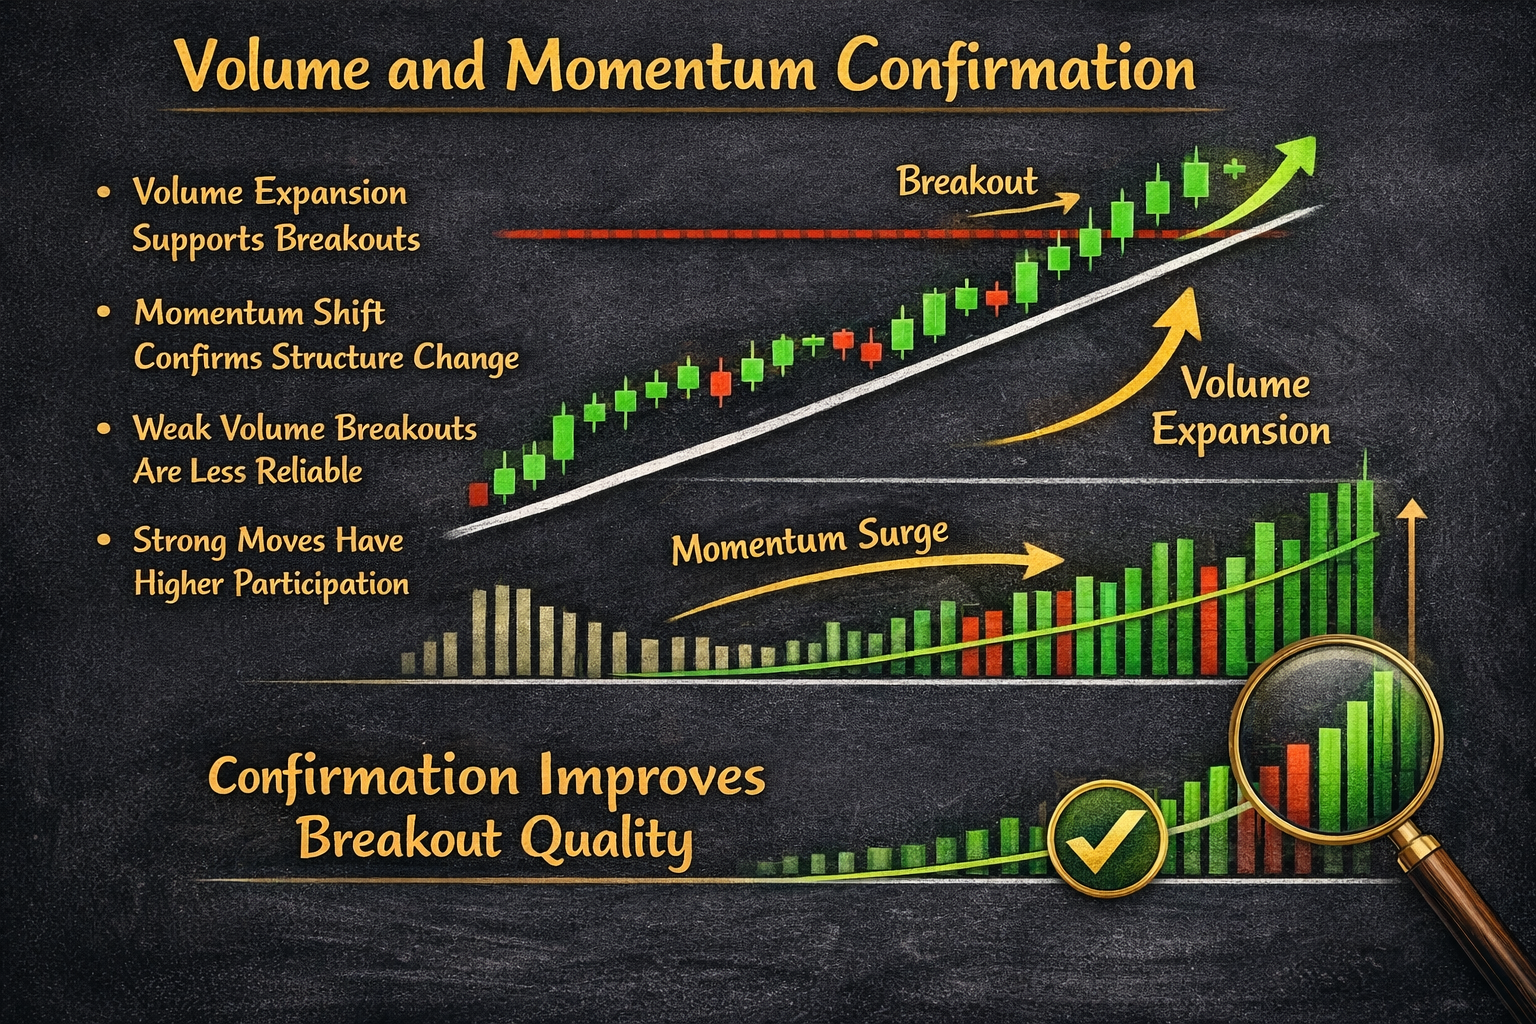
Breakouts supported by increasing volume and improving momentum are often more reliable than quiet breakouts. Strong participation suggests that more market participants agree with the move. Weak volume breakouts can still work, but they often have a higher chance of failing.
- Volume expansion can support breakouts.
- Momentum shifts help confirm structure changes.
- Weak volume breakouts are less reliable.
- Strong moves often have participation.
- Confirmation improves breakout quality.
How WOI Scanner detects downtrend breaks
The WOI Scanner detects downtrend breaks by identifying falling resistance structures and checking whether price has recently broken above those structures. The scanner also evaluates freshness, distance from the breakout, and nearby resistance levels to help rank the quality of breakout setups.
- Scanner identifies falling resistance lines.
- Breakout freshness is evaluated.
- Distance from breakout level is measured.
- Nearby resistance is considered.
- Breakouts are ranked by structure quality.
Checklist
Before trading a downtrend breakout, traders should confirm that the break is meaningful, the structure supports the idea, and the risk is defined.
- Was the original downtrend structure meaningful?
- Did price break with follow-through?
- Is price holding above the breakout level?
- Is there nearby resistance?
- Where is invalidation?
- Is risk-reward acceptable?
Apply this in WOI
Open the scanner, pick one symbol, and practice:
mark zones, decide trend regime, and write one invalidation level.
The goal is a repeatable process, not perfect predictions.
Disclaimer: Educational content only. Not financial advice.